
Observe Coordinates of Points in 4 Quadrants
Loading the math board and drawing, please wait…
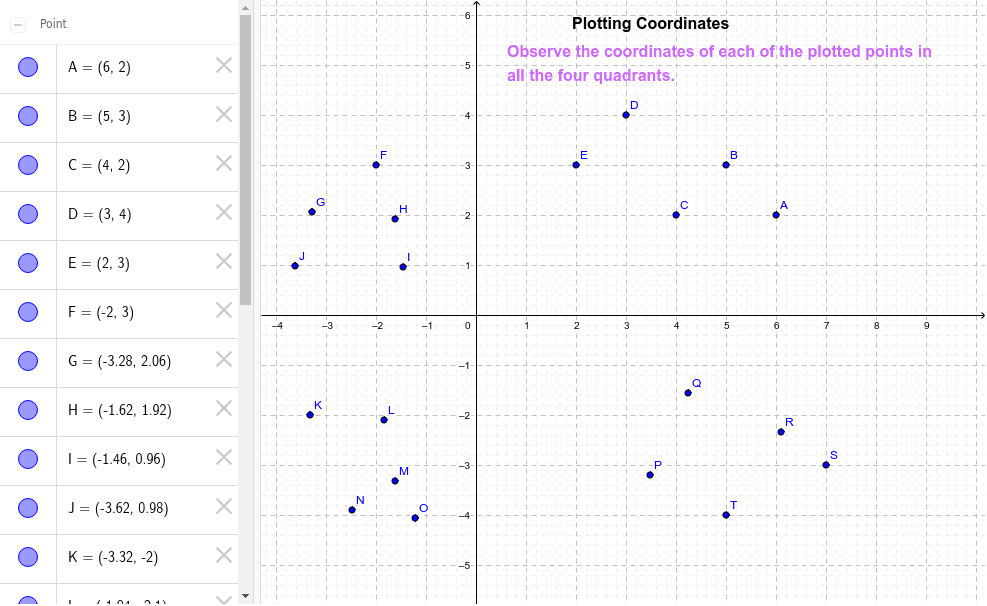
This example demonstrates plotting points in all four quadrants and observing their coordinates. Key math concepts include coordinate geometry, quadrant division, and point positioning. It uses GeoGebra objects like points(A, B, C, ..., T) and texts(text1, text2). Suitable for middle school students and above to learn coordinate geometry and understand quadrant distribution.
GeoGebra Commands & Parameters
Point A(6.0, 2.0)Point B(5.0, 3.0)Point C(4.0, 2.0)Point D(3.0, 4.0)Point E(2.0, 3.0)Point F(-2.0, 3.0)Point G(-3.2800000000000002, 2.06)Point H(-1.62, 1.92)Point I(-1.46, 0.96)Point J(-3.62, 0.98)Point K(-3.3200000000000003, -2.0)Point L(-1.84, -2.1)Point M(-1.62, -3.3200000000000003)Point N(-2.48, -3.9)Point O(-1.22, -4.0600000000000005)Point P(3.48, -3.2)Point Q(4.24, -1.56)Point R(6.1000000000000005, -2.34)Point S(7.0, -3.0)Point T(5.0, -4.0)
AI Drawing Prompt Reference
Plot twenty points on a coordinate plane, spread across all four quadrants. In the first quadrant, place five points forming a gentle upward curve from near the origin to the right. In the second quadrant, arrange five points in a wavy or zigzag pattern. In the third quadrant, position five points along a downward arc. In the fourth quadrant, distribute five points moving downward to the right. Mark each point with a small solid dot and display its coordinate values nearby. The overall layout helps observe how positive and negative coordinates relate to quadrant positions.
The prompt above was compiled from the original drawing commands and is for reference only.