
Number Line Zoom In: Same Axis, Different Scales
Loading the math board and drawing, please wait…
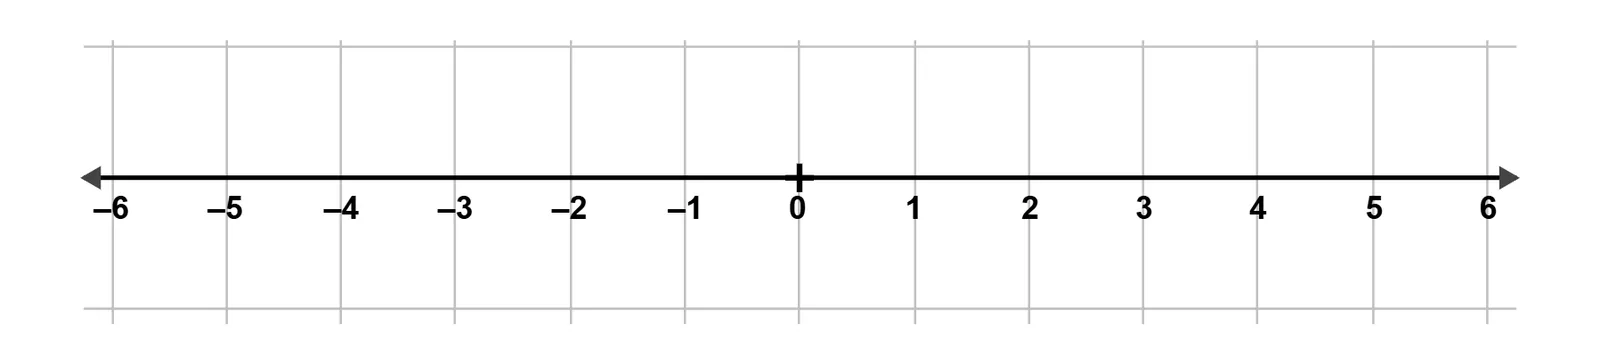
This GeoGebra example demonstrates how a number line’s appearance changes under zoom-in/zoom-out viewing windows, letting learners compare large and small magnitudes on the same axis with a clear sense of scale. It targets core ideas such as the real number line, coordinate/tick interpretation, and reasoning about numeric magnitude and interval relationships through observation under scaling. Construction (from the provided summary) uses the GeoGebra commands Corner and Polygon to build the geometric zoom frame/shape from points A, B, C, D, E, P1–P4, and P5–P6, while scaleh and scalev control horizontal and vertical scaling to drive the zoom effect. Suitable for middle to high school math lessons and for interactive visualization practice where students explore real numbers and inequalities through dynamic scaling.
GeoGebra Commands & Parameters
Corner(1) → BCorner(2) → CCorner(3) → DCorner(4) → EPolygon({P1, P2, P3, P4}) → q1
AI Drawing Prompt Reference
Draw a number line with tick marks labeled A, B, C, D, E. Also include points P1, P2, P3, P4 and P5, P6 on the line. The tick marks indicate numerical values, with points closer to the origin representing smaller numbers and points farther away representing larger numbers. The points help compare magnitudes and interval relationships.
The prompt above was compiled from the original drawing commands and is for reference only.