
Number Line for Data Metrics: Regression, Median, and Standard Deviation
Loading the math board and drawing, please wait…
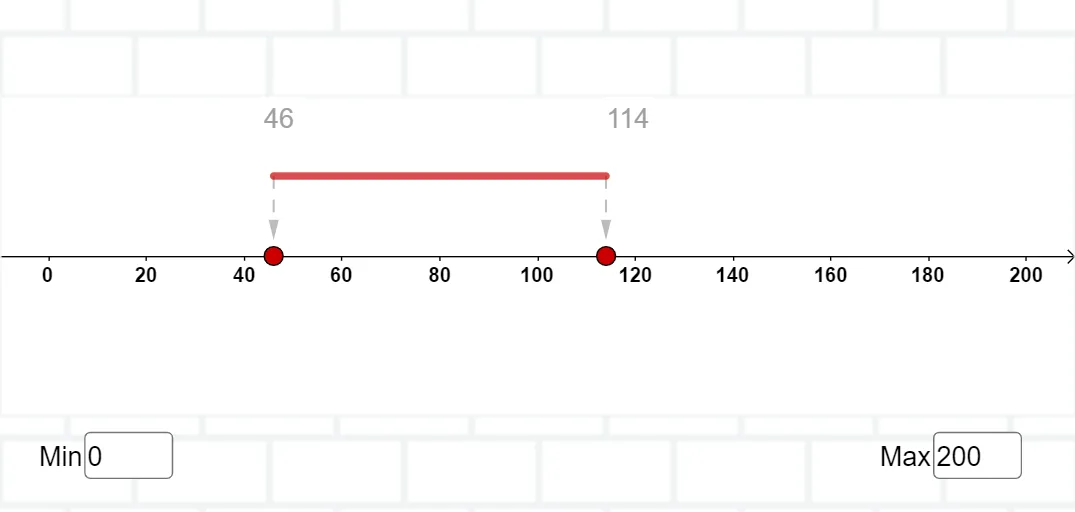
This GeoGebra example visualizes data on a one-dimensional number line, using geometric constructions and transformations to build intuition for statistics such as the median and the standard deviation, alongside linear regression trends. It connects basic arithmetic (addition/subtraction as displacements) with deeper ideas: linear regression as a fitting rule, the median as a measure of central tendency, and standard deviation as a measure of spread. Construction highlights from the command summary include Segment and Point to create the number-line interval and key reference points, Polygon to emphasize selected ranges/regions, Textfield and Text to input parameters and label computed results, and Vector to represent translation/displacement quantities; Vector-based objects (u, v) and parameter-driven elements (InputBox1/2, q1, f, Pmin/Pmax) help control the computed/statistical visuals. It is appropriate for middle and high school learners in probability & statistics and for students doing hands-on math visualization and exploration.
GeoGebra Commands & Parameters
Segment((xmin, 0), (xmax, 0)) → gPoint(g) → AAPolygon({(LEFT, -1), (LEFT, 1), (RIGHT, 1), (RIGHT, -1)}) → q1Textfield(xmin) → InputBox1Textfield(xmax) → InputBox2Point(g) → BBVector((x(AA), 0.5), (x(AA), 0.1)) → uVector((x(BB), 0.5), (x(BB), 0.1)) → vSegment((x(AA), 0.5), (x(BB), 0.5)) → fText(x(AA)) → text1Text(x(BB)) → text2
AI Drawing Prompt Reference
Visualize data on a one-dimensional number line, including regression line, median, and standard deviation. Draw a horizontal line segment as the number line and mark key points on it. Use a polygon to highlight selected ranges or regions. Represent displacements with vectors and use text fields to input parameters and label computed results. Show the linear regression trend, the median as a measure of central tendency, and the standard deviation as a measure of spread.
The prompt above was compiled from the original drawing commands and is for reference only.