
Number Line Drawing Tool by 現代中學數學 Modern Secondary Mathematics
Loading the math board and drawing, please wait…
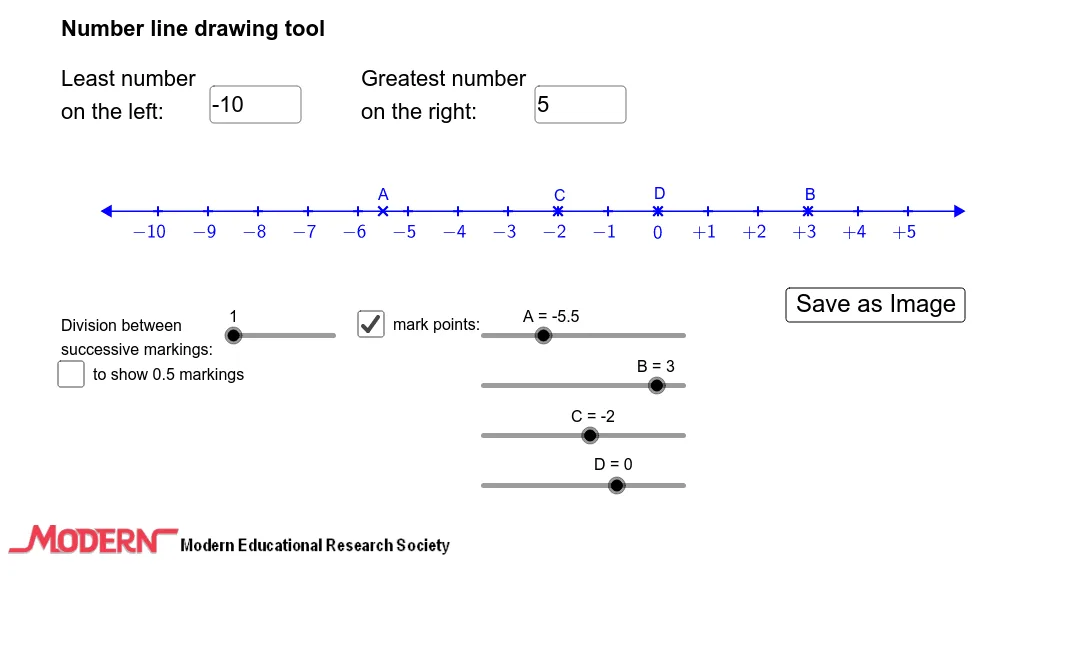
This example demonstrates the method of drawing a number line. Key mathematical concepts include number lines and random variables. Using GeoGebra commands such as Segment, Sequence, and Textfield, it dynamically shows points, intervals, and changes in random variables on the number line. Suitable for middle school and above students to learn about number lines and applications of random variables.
GeoGebra Commands & Parameters
Segment(left, right) → fSequence((x(left) + i, y(left)), i, 1, e + 1, 1) → list1Sequence(floor(a + (d * i)), i, 0, e, 1) → list2Sequence(If[Element[list2, i] < 0, "-", If[Element[list2, i] > 0, "+"]], i, 1, e + 1, 1) → list5Sequence((Element[list5, i] * sqrt(Element[list2, i]^(2))), i, 1, e + 1, 1) → list6Sequence(If[Element[list2, i] ≤ -10, 2, If[Element[list2, i] ≥ 10, 2, If[Element[list2, i] < 0, 1, If[Element[list2, i] > 0, 1, -0.2]]]], i, 1, e + 1, 1) → list7Textfield(a) → InputBox1Textfield(b) → InputBox2Sequence((x(left) + i + 0.5, y(left)), i, 1, e, 1) → list8
AI Drawing Prompt Reference
Draw a horizontal number line from a left endpoint to a right endpoint, with evenly spaced tick marks along it. Below each tick mark, place a numeric value determined by a random variable, which can be positive, negative, or zero. Above positive ticks show a plus sign, above negative ticks show a minus sign, and zero ticks get a special marker. Above the line, place several text input boxes at intervals to control the parameter range. The display updates dynamically as values change.
The prompt above was compiled from the original drawing commands and is for reference only.