
Normal Probability Curve Dynamic
Loading the math board and drawing, please wait…
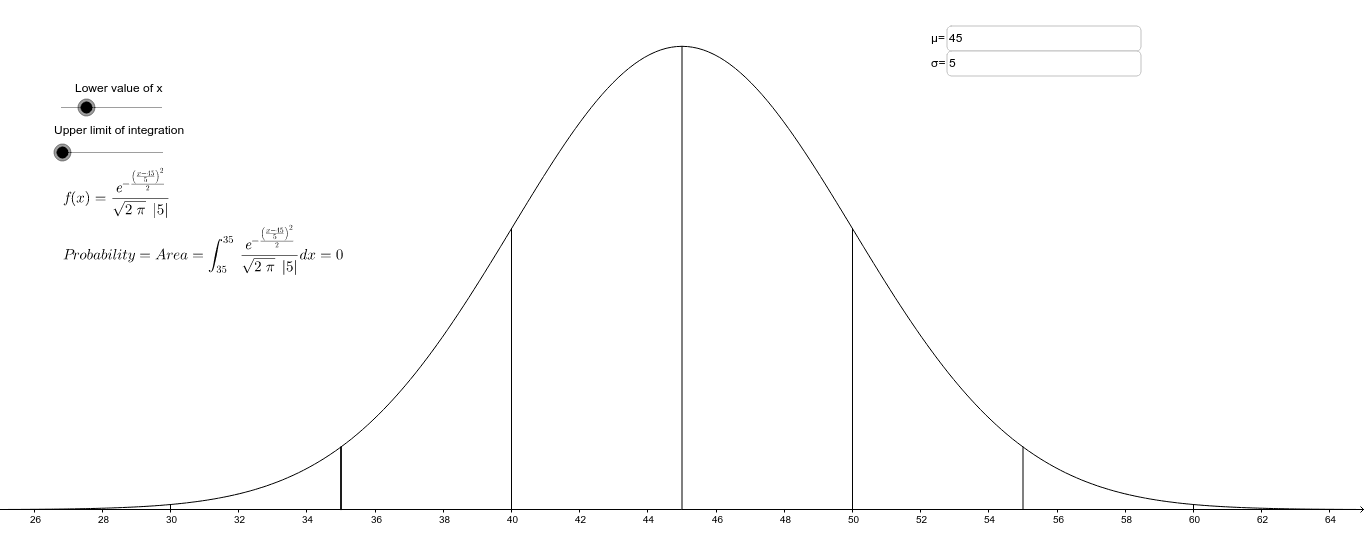
This example demonstrates the dynamic behavior of the normal probability distribution curve. Normal distribution is a fundamental concept in statistics, describing the central tendency and dispersion of data. The construction involves using GeoGebra commands like Textfield, Segment, and Integral, along with parameters such as Mean and sd. This example is suitable for high school students learning probability statistics or for mathematical modeling education.
GeoGebra Commands & Parameters
Textfield(Mean) → inputBox1Textfield(sd) → inputBox2Segment(B, A) → aSegment(C, G) → bSegment(D, I) → cSegment(L, O) → dSegment(M, N) → eSegment(H, E) → gSegment(F, J) → hIntegral(f, Lowerx, i) → j