
Normal Distribution Sliders Interactive Demo
Loading the math board and drawing, please wait…
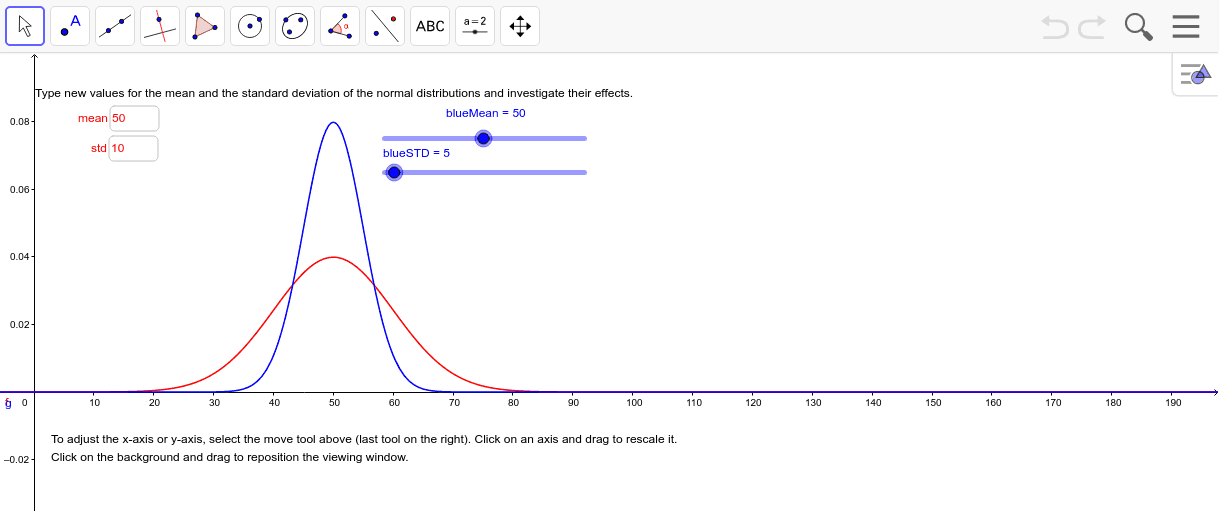
① This example demonstrates how a normal distribution curve changes dynamically as the mean and standard deviation are adjusted via draggable sliders. ② The core mathematical concept is the normal distribution, focusing on the probability density function and the effects of mean (μ) and standard deviation (σ) on the curve's center and spread. ③ Construction highlights: The Normal command generates the distribution function, while Textfield input boxes and sliders (a, b, c, d) control parameters; objects like blueMean and blueSTD label the mean and standard deviation, updating the graph in real time. ④ Suitable for high school or introductory college statistics courses, ideal for classroom demonstrations or self-guided exploration of how parameter changes affect the distribution shape.
GeoGebra Commands & Parameters
Normal(a, b, x) → fTextfield(a) → inputBox1Textfield(b) → inputBox2Normal(blueMean, blueSTD, x) → g