
Normal Distributions: Interactive Parameter Exploration
Loading the math board and drawing, please wait…
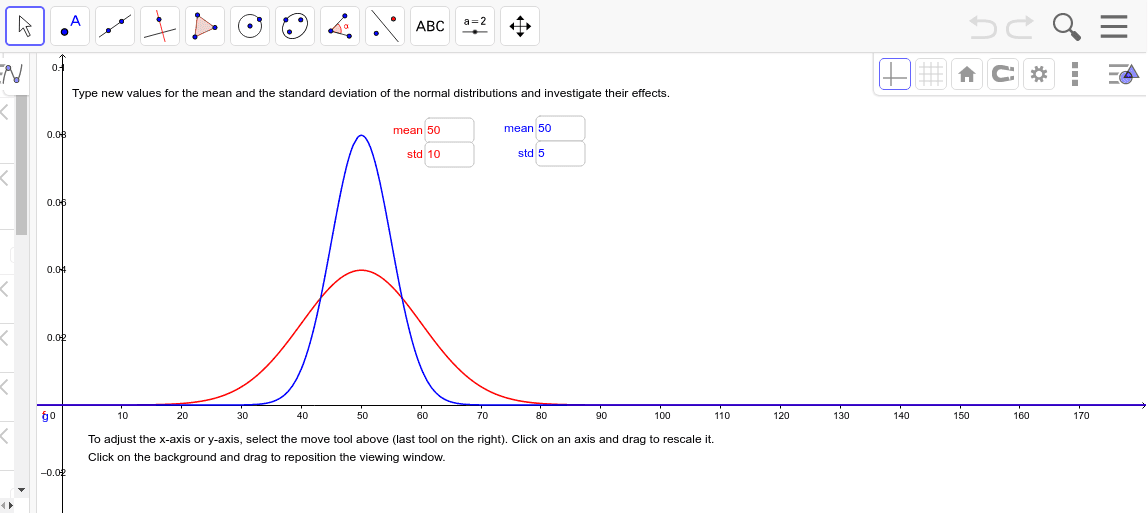
① This GeoGebra example dynamically demonstrates normal distribution curves, allowing users to adjust mean and standard deviation parameters to observe shape changes. ② Core mathematical concepts include the normal probability density function, the role of mean (location) and standard deviation (scale) in shifting and stretching the curve, and symmetry. ③ Construction uses the Normal command to generate distribution functions, Textfield input boxes and sliders (objects a, b, c, d) for parameter control, text objects (text1, text2) to display values, and function objects f and g for curves. ④ Suitable for high school and college statistics/probability courses, ideal for understanding parameter effects, comparing distributions, and as an interactive teaching tool.
GeoGebra Commands & Parameters
Normal(a, b, x) → fTextfield(a) → inputBox1Textfield(b) → inputBox2Textfield(c) → inputBox3Textfield(d) → inputBox4Normal(c, d, x) → g
AI Drawing Prompt Reference
Draw a normal distribution curve and observe its changes by adjusting the mean and standard deviation. Use input fields to set the mean and standard deviation, generating two curves f and g, where f has a mean of a and a standard deviation of b, and g has a mean of c and a standard deviation of d, to demonstrate the shape, position, and scale variations of the normal distribution.
The prompt above was compiled from the original drawing commands and is for reference only.