
Probability of Winning a 7-Game Series with Varying Home/Away Odds
Loading the math board and drawing, please wait…
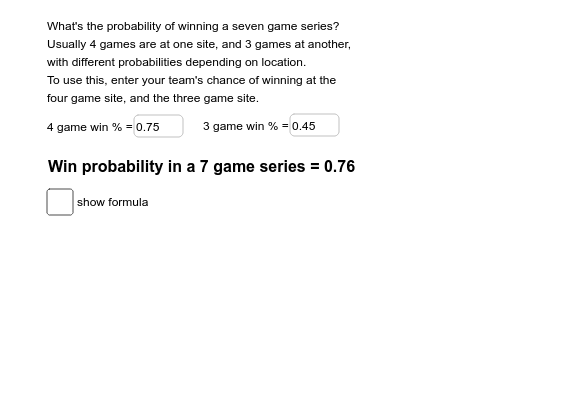
This GeoGebra example demonstrates a dynamic model for calculating the probability of winning a best-of-seven series when home and away game win probabilities differ. It visualizes how the overall series win probability changes based on user-defined inputs for home win rate (p) and away win rate (q). Core mathematical concepts include probability theory, independent events, binomial distribution, combinatorial counting, and conditional probability, with auxiliary use of quadratic functions and parametric curves to represent probability paths. The construction uses GeoGebra text fields (Textfield, InputBox1, InputBox2) for user input, a parameter (a) to control series progression, and text objects (text1, text2, text3) to display intermediate and final probabilities. This model is suitable for high school and college students studying probability and statistics, combinatorics, or sports analytics, and can be used to explore how home-court advantage affects the outcome of a playoff series.
GeoGebra Commands & Parameters
Textfield(p) → InputBox1Textfield(q) → InputBox2
AI Drawing Prompt Reference
Create a dynamic model illustrating the probability of winning a best-of-seven series with different home and away win rates. Include two input fields for setting the home win probability and away win probability. Use a slider to control the series progression, showing intermediate and final win probabilities as text. Visualize how the overall series win probability changes with the input rates, possibly through curves or parametric paths. The layout should be clean and educational, emphasizing probability theory and combinatorial counting.
The prompt above was compiled from the original drawing commands and is for reference only.