
Normal Distribution Probability Calculation by GeoGebra Team
Loading the math board and drawing, please wait…
In collections
Learn GeoGebra Classic
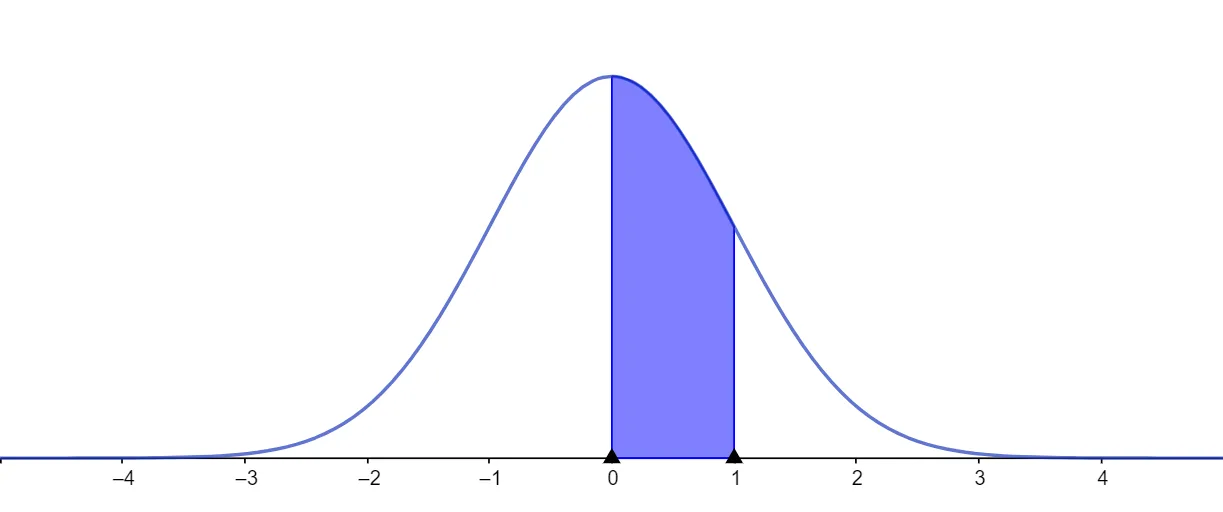
This example demonstrates how to calculate the probability of a normal distribution using GeoGebra. The core math concepts involved are the normal distribution and its probability density function. Key construction points include plotting the normal distribution curve and computing probabilities over specific intervals. Suitable for high school and above students to learn and understand the application of the normal distribution in probability and statistics.
AI Drawing Prompt Reference
Draw a normal distribution curve and display its probability density function, while indicating the probability calculation process over specific intervals to help students understand the application of the normal distribution in probability and statistics.
The prompt above was compiled from the original drawing commands and is for reference only.