
Normal Distribution Modeling
Loading the math board and drawing, please wait…
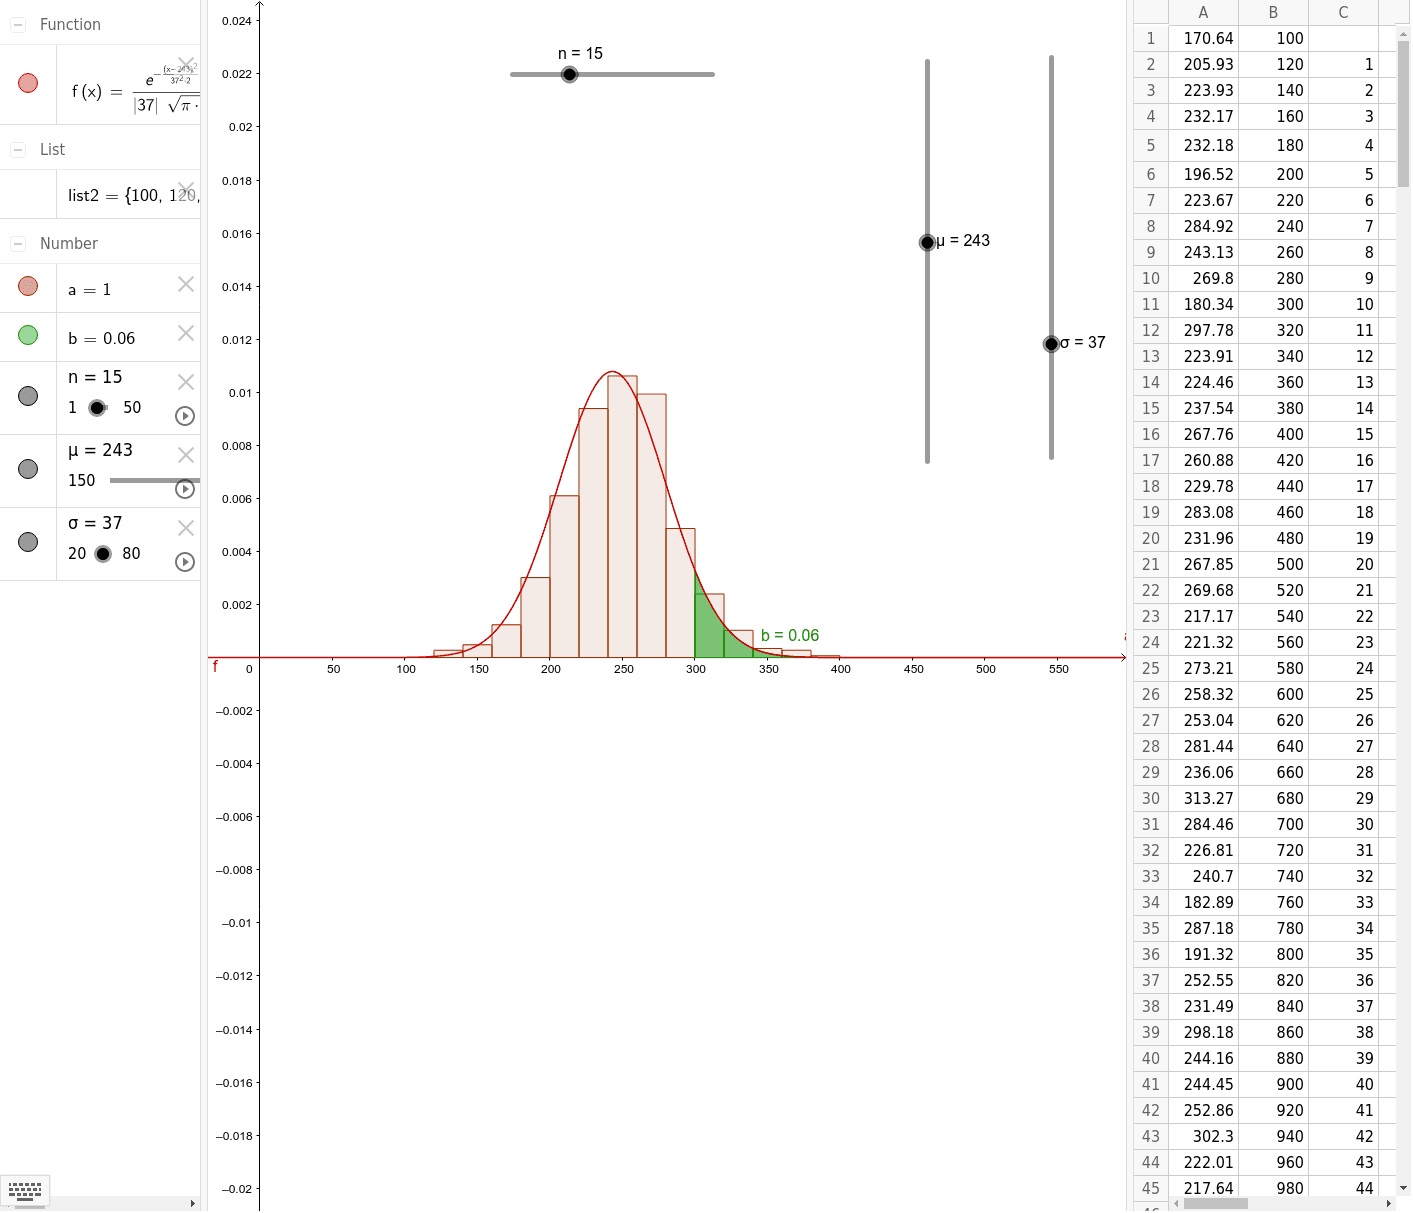
This example demonstrates the graphical representation and characteristics of the normal distribution. It covers key concepts such as mean, standard deviation, and probability density function. Using GeoGebra commands like Normal, Histogram, and Integral, users can visually understand how the shape and parameters of the distribution are affected. Suitable for high school and above students and teachers.
GeoGebra Commands & Parameters
Normal(μ, σ, x) → fHistogram(list2, F5, true, 1 / 730) → aIntegral(f, 300, 400) → bMean(F5) → E4SD(F5) → E5