
Normal Distribution Modeling by Rupert
Loading the math board and drawing, please wait…
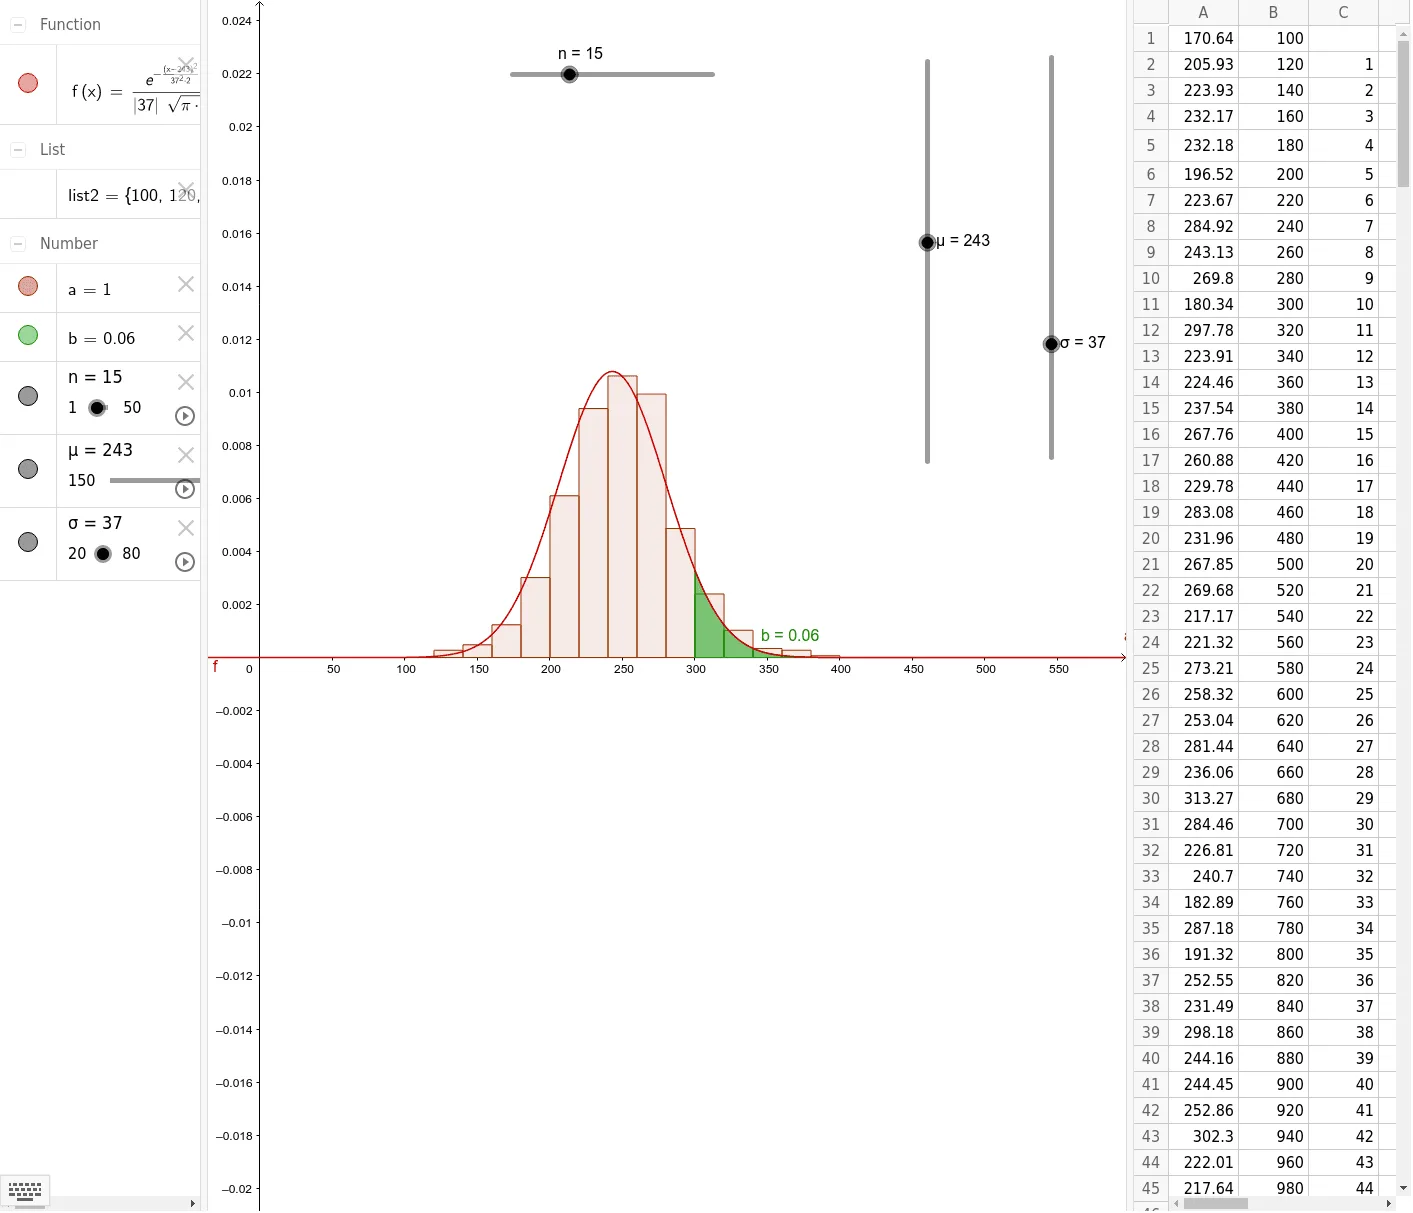
This example demonstrates how to construct a normal distribution and its related statistics using GeoGebra, covering core concepts like the normal distribution function, histogram, integral, mean, and standard deviation. Key GeoGebra commands and objects used include Normal, Histogram, Integral, Mean, SD, and multiple objects labeled A1-A40. Suitable for high school students and educators.
GeoGebra Commands & Parameters
Normal(μ, σ, x) → fHistogram(list2, F5, true, 1 / 730) → aIntegral(f, 300, 400) → bMean(F5) → E4SD(F5) → E5
AI Drawing Prompt Reference
Draw a normal distribution curve with its corresponding histogram, integral area, mean, and standard deviation. The normal curve is defined by mean and standard deviation, the histogram is generated from the normal distribution data, and the integral area is between 300 and 400. Calculate the mean and standard deviation from the dataset, ensuring all elements are clearly displayed and interconnected.
The prompt above was compiled from the original drawing commands and is for reference only.