
Normal Distribution: Mean, StdDev
Loading the math board and drawing, please wait…
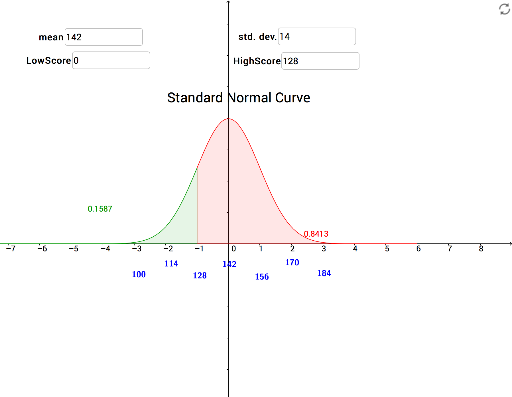
This example demonstrates how the normal distribution curve dynamically changes based on given mean and standard deviation. Core math concepts include normal distribution, mean, standard deviation, integral, and parametric equations. Construction highlights involve using Normal command for plotting, Integral for probability calculation, Textfield and LaTeX for displaying formulas and text, and Slider for dynamic parameter adjustment. Suitable for high school students and teachers needing a visual understanding of probability & statistics.
GeoGebra Commands & Parameters
Normal(0, 1, x) → fIntegral(f, zUp, 6) → aIntegral(f, -6, zDwn) → bIntegral(f, zDwn, zUp) → cTextfield(xbar) → inputBox1Textfield(stdev) → inputBox2Textfield(xl) → inputBox3Textfield(xh) → inputBox4LaTeX(xbar) → text2LaTeX(two) → text4LaTeX(three) → text5LaTeX(none) → text6LaTeX(ntwo) → text7LaTeX(nthree) → text8LaTeX(one) → text9
AI Drawing Prompt Reference
Draw a dynamic normal distribution curve with adjustable mean and standard deviation using sliders, display the mean, standard deviation, and probability calculation results, and use text boxes and formulas to show relevant mathematical expressions and parameter values.
The prompt above was compiled from the original drawing commands and is for reference only.