
Normal Distribution Interactive Worksheet: Exploring Mean and Standard Deviation
Loading the math board and drawing, please wait…
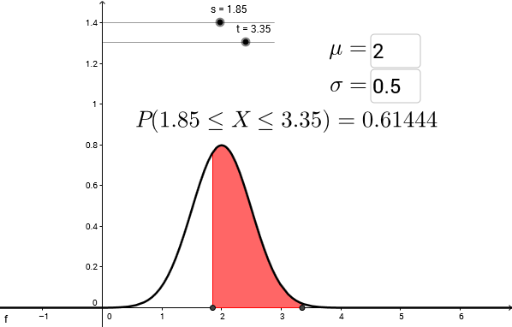
① This GeoGebra example provides an interactive worksheet where users can adjust the mean (M) and standard deviation (s) via text fields and input boxes, observing how the bell-shaped normal distribution curve shifts, widens, or narrows, and simultaneously calculates the probability (area) under the curve for a specified interval using the Integral command. ② The core mathematical concepts include the normal probability density function, cumulative distribution function, the role of mean and standard deviation in shaping the distribution, and the use of definite integrals to compute probabilities. ③ Construction highlights: the worksheet employs Textfield and InputBox objects for parameter entry, the Integral command to compute the shaded area, and objects such as S, a, M, f, s, t, N, A, P1, P2, and text1-3 to create dynamic visual feedback and textual results. ④ This resource is suitable for high school or introductory college statistics and probability courses, enabling students to explore properties of the normal distribution, verify the empirical rule (68-95-99.7), and understand how to compute probabilities via integration.
GeoGebra Commands & Parameters
Textfield(M) → InputBox1Integral(f, s, t) → ATextfield(S) → InputBox2