
Normal Distribution Demo: Integration and Probability
Loading the math board and drawing, please wait…
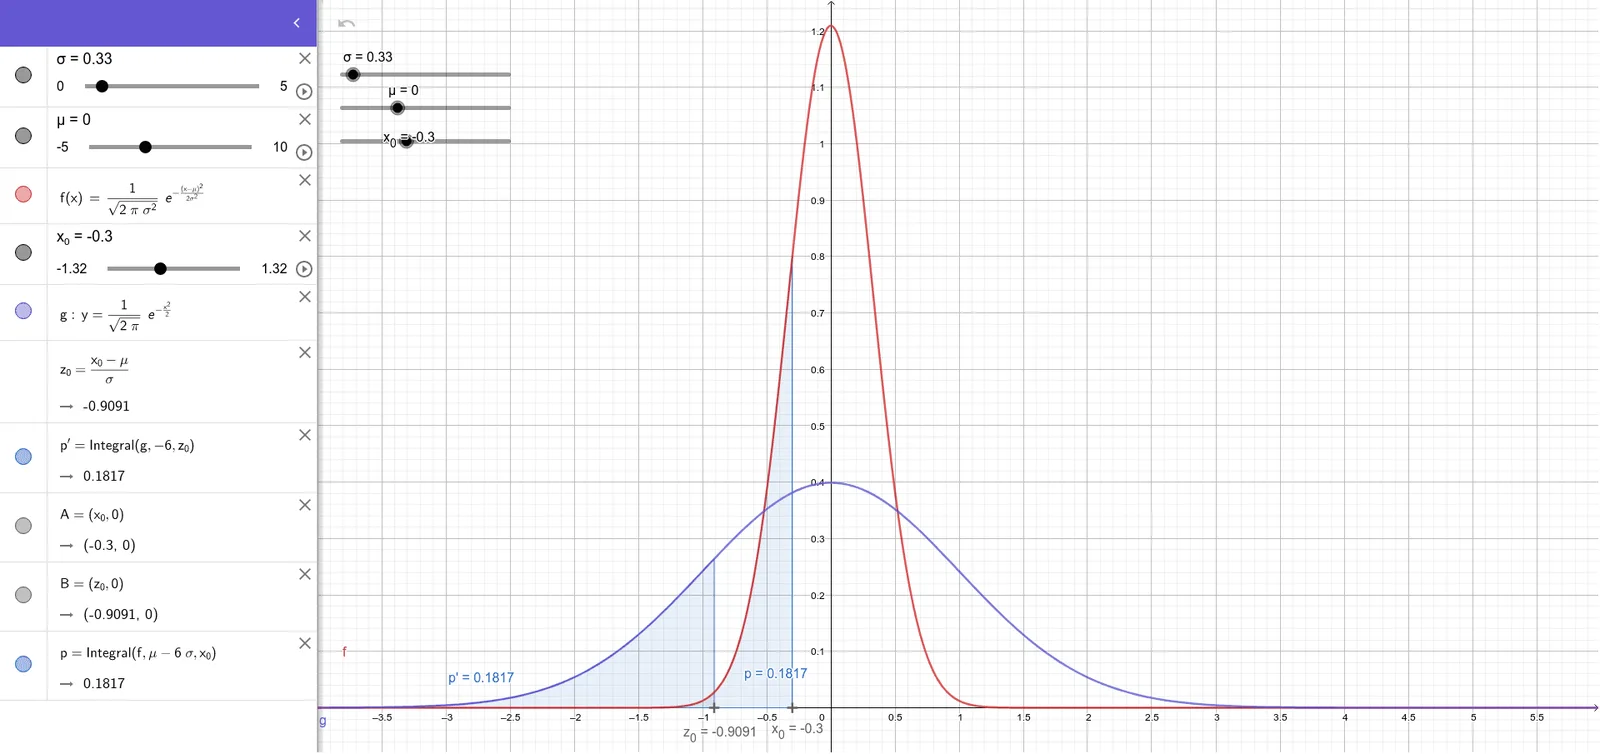
This GeoGebra example dynamically illustrates the normal distribution curve and its integral area, showing the relationship between the probability density function and cumulative probability. Core mathematical concepts include normal distribution (parameters μ and σ), probability density function, definite integral for area, expected value, and standard normal transformation. Construction highlights: the Integral command computes the area under the curve from negative infinity to x₀, with objects σ, μ, f (density function), x₀ (upper limit), g (auxiliary function), z_0 (standardized variable), p' (probability value), A, B (area regions), and p (probability point). Suitable for high school and college statistics and calculus courses, this demo helps students understand normal distribution properties, z-scores, and probability calculations. It serves as an interactive teaching tool for instructors or a self-exploration resource for learners.
GeoGebra Commands & Parameters
Integral(g, -6, z_0) → p'Integral(f, μ - (6 * σ), x_{0}) → p
AI Drawing Prompt Reference
Draw a normal distribution curve with sliders for mean and standard deviation, showing the integral area from negative infinity to a point, colored differently, and label the probability value at that point and the standardized variable, illustrating the relationship between the probability density function and cumulative probability, suitable for educational demonstration.
The prompt above was compiled from the original drawing commands and is for reference only.