
Normal Distribution and Parallelogram Symmetry Exploration (H2M L16 Q3)
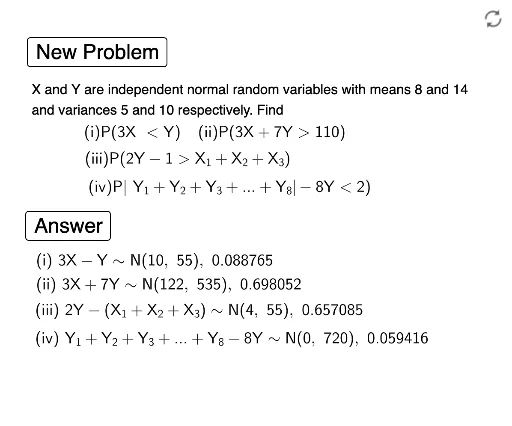
Loading the math board and drawing, please wait…
①This GeoGebra example dynamically demonstrates the symmetric relationship between a normal distribution curve and special points of a parallelogram, with random buttons generating different parameter scenarios. ②Core mathematical concepts include the probability density function of the normal distribution, geometric properties of parallelograms, symmetry, and inequalities defining regions. ③Construction highlights: using Random, If, and Normal commands to generate random data and normal functions; buttons (button1, button2) control dynamic updates; objects include points (o, a, b1, b2, b3), vectors (vx, vy), curves (c1, c2), and multiple text labels (text1 to text11) for annotations. ④Suitable for high school or introductory college courses in probability and geometry, useful for classroom demonstrations or self-study to explore the interplay between statistical distributions and geometric symmetry.
GeoGebra Commands & Parameters
Random(2, 4) → aRandom(4, 8) → b2Random(3, 5) → b1Random(8, 11) → mxRandom(12, 15) → myRandom(4, 6) → vxRandom(9, 12) → vyRandom(2, 4) → c1Random(1, 3) → c2Random(8, 12) → d1Random(1, 4) → d2If(f ≟ 2, text3, text4) → text6Normal(mi, sqrt(vi), 0, true) → i
AI Drawing Prompt Reference
Create a dynamic illustration showing the symmetric relationship between a normal distribution curve and special points of a parallelogram, with randomly generated scenarios for different parameters. Include a normal distribution curve, several points, vectors, and curves, along with text labels for annotations. Use random buttons to generate data points and normal distribution functions, and allow dynamic updates via buttons to demonstrate the probability density function of the normal distribution, geometric properties of the parallelogram, symmetry, and inequalities defining regions.
The prompt above was compiled from the original drawing commands and is for reference only.