
Normal Approximation to the Binomial Distribution (1)
Loading the math board and drawing, please wait…
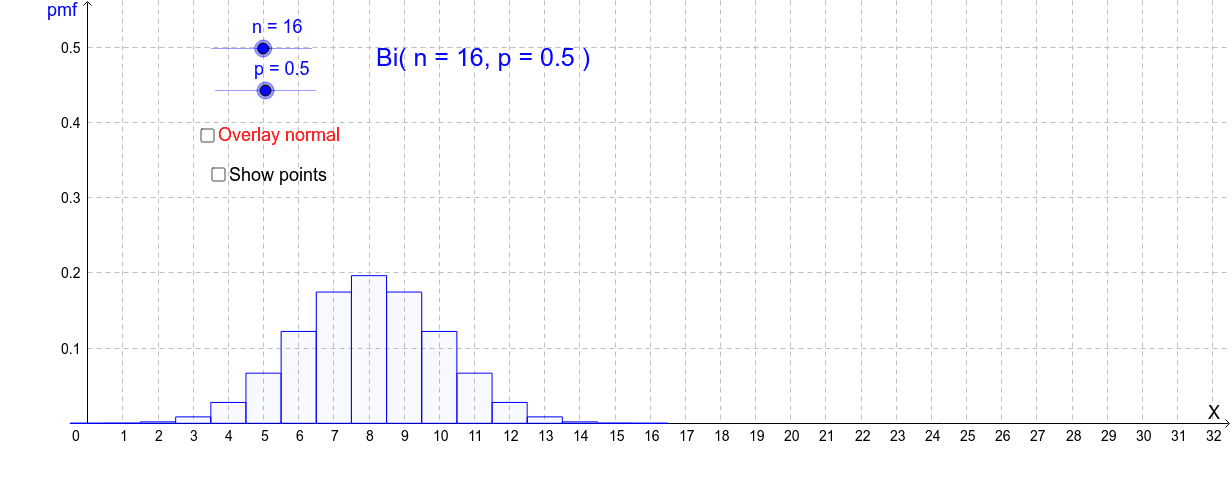
This example demonstrates the normal approximation to the binomial distribution. By simulating random samples from a binomial distribution and plotting the frequency histogram alongside the normal distribution curve, it visually illustrates how the normal distribution approximates the binomial distribution. Key mathematical concepts involved include binomial distribution, normal distribution, expected value, and standard deviation. The construction utilizes GeoGebra commands and objects such as Point, If, BinomialDist, BarChart, Integral, with sliders to dynamically adjust parameters n and p to observe the goodness of fit between the normal curve and the histogram. Suitable for high school and above students learning about the central limit theorem in probability and statistics.
GeoGebra Commands & Parameters
Point(xAxis) → AIf(showLeft, (-10, 0), (32, 0)) → BIf(showLeft, round(x(A)), 32) → bIf(showLeft, -10, round(x(A))) → aBinomialDist(n, p) → fullbinBarChart(a - 0.5, b + 0.5, Sequence[((Binomial[n, r] * p^(r)) * (1 - p)^(n - r)), r, a, b]) → binomialPoint(xAxis) → CPoint(xAxis) → DIf(showLeft, -10, x(C)) → cIf(showLeft, x(C), 32) → dIntegral(f, c, d) → normal
AI Drawing Prompt Reference
Draw a graph demonstrating the normal approximation to the binomial distribution, featuring a frequency histogram and a normal distribution curve. The histogram represents the frequency of random samples from a binomial distribution, while the curve shows the theoretical normal distribution. Use sliders to dynamically adjust the parameters n and p of the binomial distribution and observe the goodness of fit between the histogram and the normal curve.
The prompt above was compiled from the original drawing commands and is for reference only.