
Dot Plot with Standard Deviation Sliders
Loading the math board and drawing, please wait…
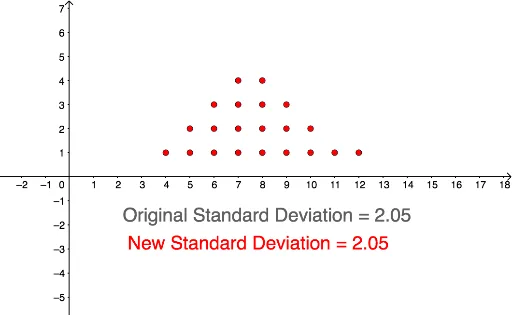
This example demonstrates creating a dot plot and calculating standard deviation using sliders. Key mathematical concepts include dot plots, standard deviation, and slider animation. By using commands like DotPlot and stdev, users can dynamically adjust data points and observe changes in standard deviation. Suitable for high school mathematics education and learning probability & statistics.
GeoGebra Commands & Parameters
DotPlot({a, b, c, d, f, g, h, j, k, l, m, n, o, p, q, r, s, t, u, v, w}) → l1stdev(a, b, m, n, o, p, q, r, s, t, u, v, c, w, d, f, g, h, j, k, l) → eLaTeX(e, true, true) → text1DotPlot({4, 5, 5, 6, 6, 6, 7, 7, 7, 7, 8, 8, 8, 8, 9, 9, 9, 10, 10, 11, 12}) → l2
AI Drawing Prompt Reference
Create a dot plot with 21 data points: 4, 5, 5, 6, 6, 6, 7, 7, 7, 7, 8, 8, 8, 8, 9, 9, 9, 10, 10, 11, 12. Also calculate and display the standard deviation of these data points.
The prompt above was compiled from the original drawing commands and is for reference only.