
Normal Approximation to Binomial Distribution by Mark Willis
Loading the math board and drawing, please wait…
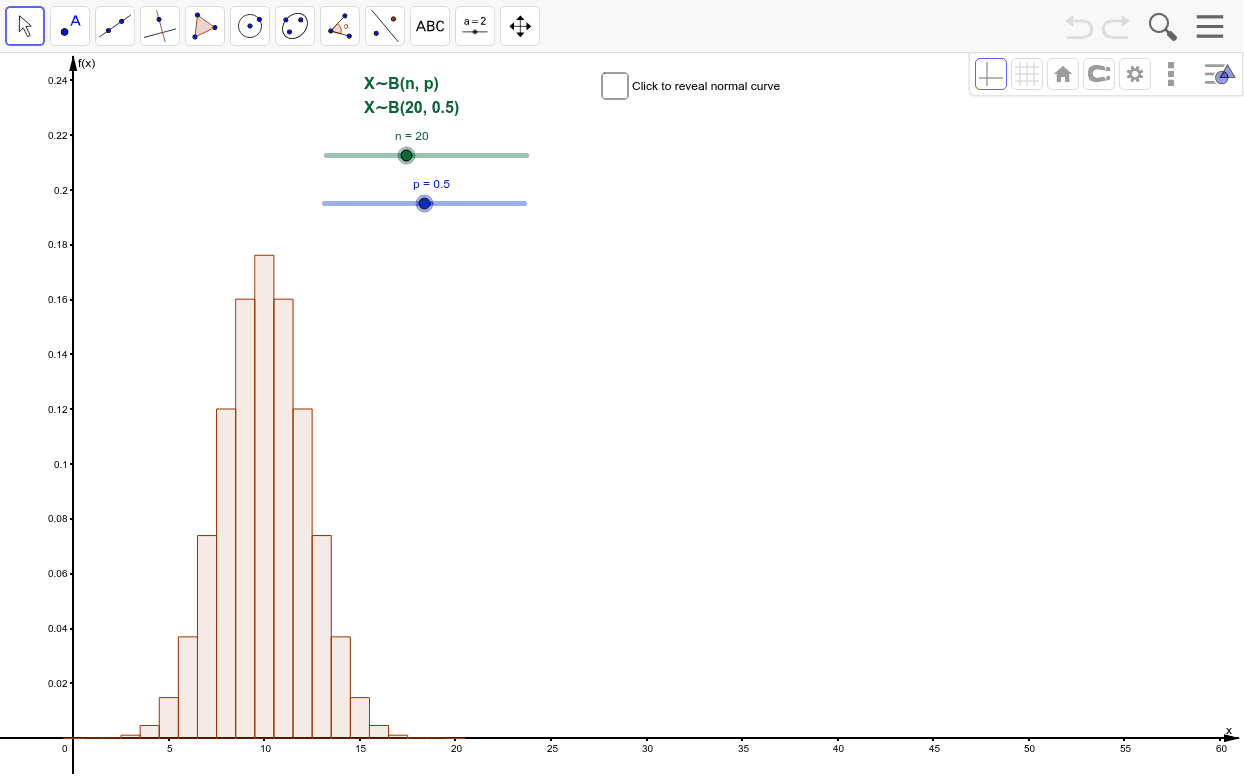
This example demonstrates how to approximate a binomial distribution with a normal distribution. Key mathematical concepts include probability distributions, parameter estimation, and normal approximation. Construction involves GeoGebra commands such as BinomialDist, Normal, and LaTeX. Suitable for high school or university probability and statistics courses.
GeoGebra Commands & Parameters
BinomialDist(n, p) → aNormal((n * p), sqrt(((n * p) * (1 - p))), x, false) → fLaTeX(f, true, true) → text1
AI Drawing Prompt Reference
Draw a graph showing the approximation of a binomial distribution with a normal distribution. Include a probability distribution plot for the binomial and a normal curve as the approximation. Both should be based on the same parameters n and p, and show their overlapping areas. The construction order should be from drawing the binomial distribution, then adding the normal curve, and finally labeling key points to explain the approximation relationship.
The prompt above was compiled from the original drawing commands and is for reference only.