
Negative Area and Complex Number Square Roots Visualization
Loading the math board and drawing, please wait…
In collections
Complex Math
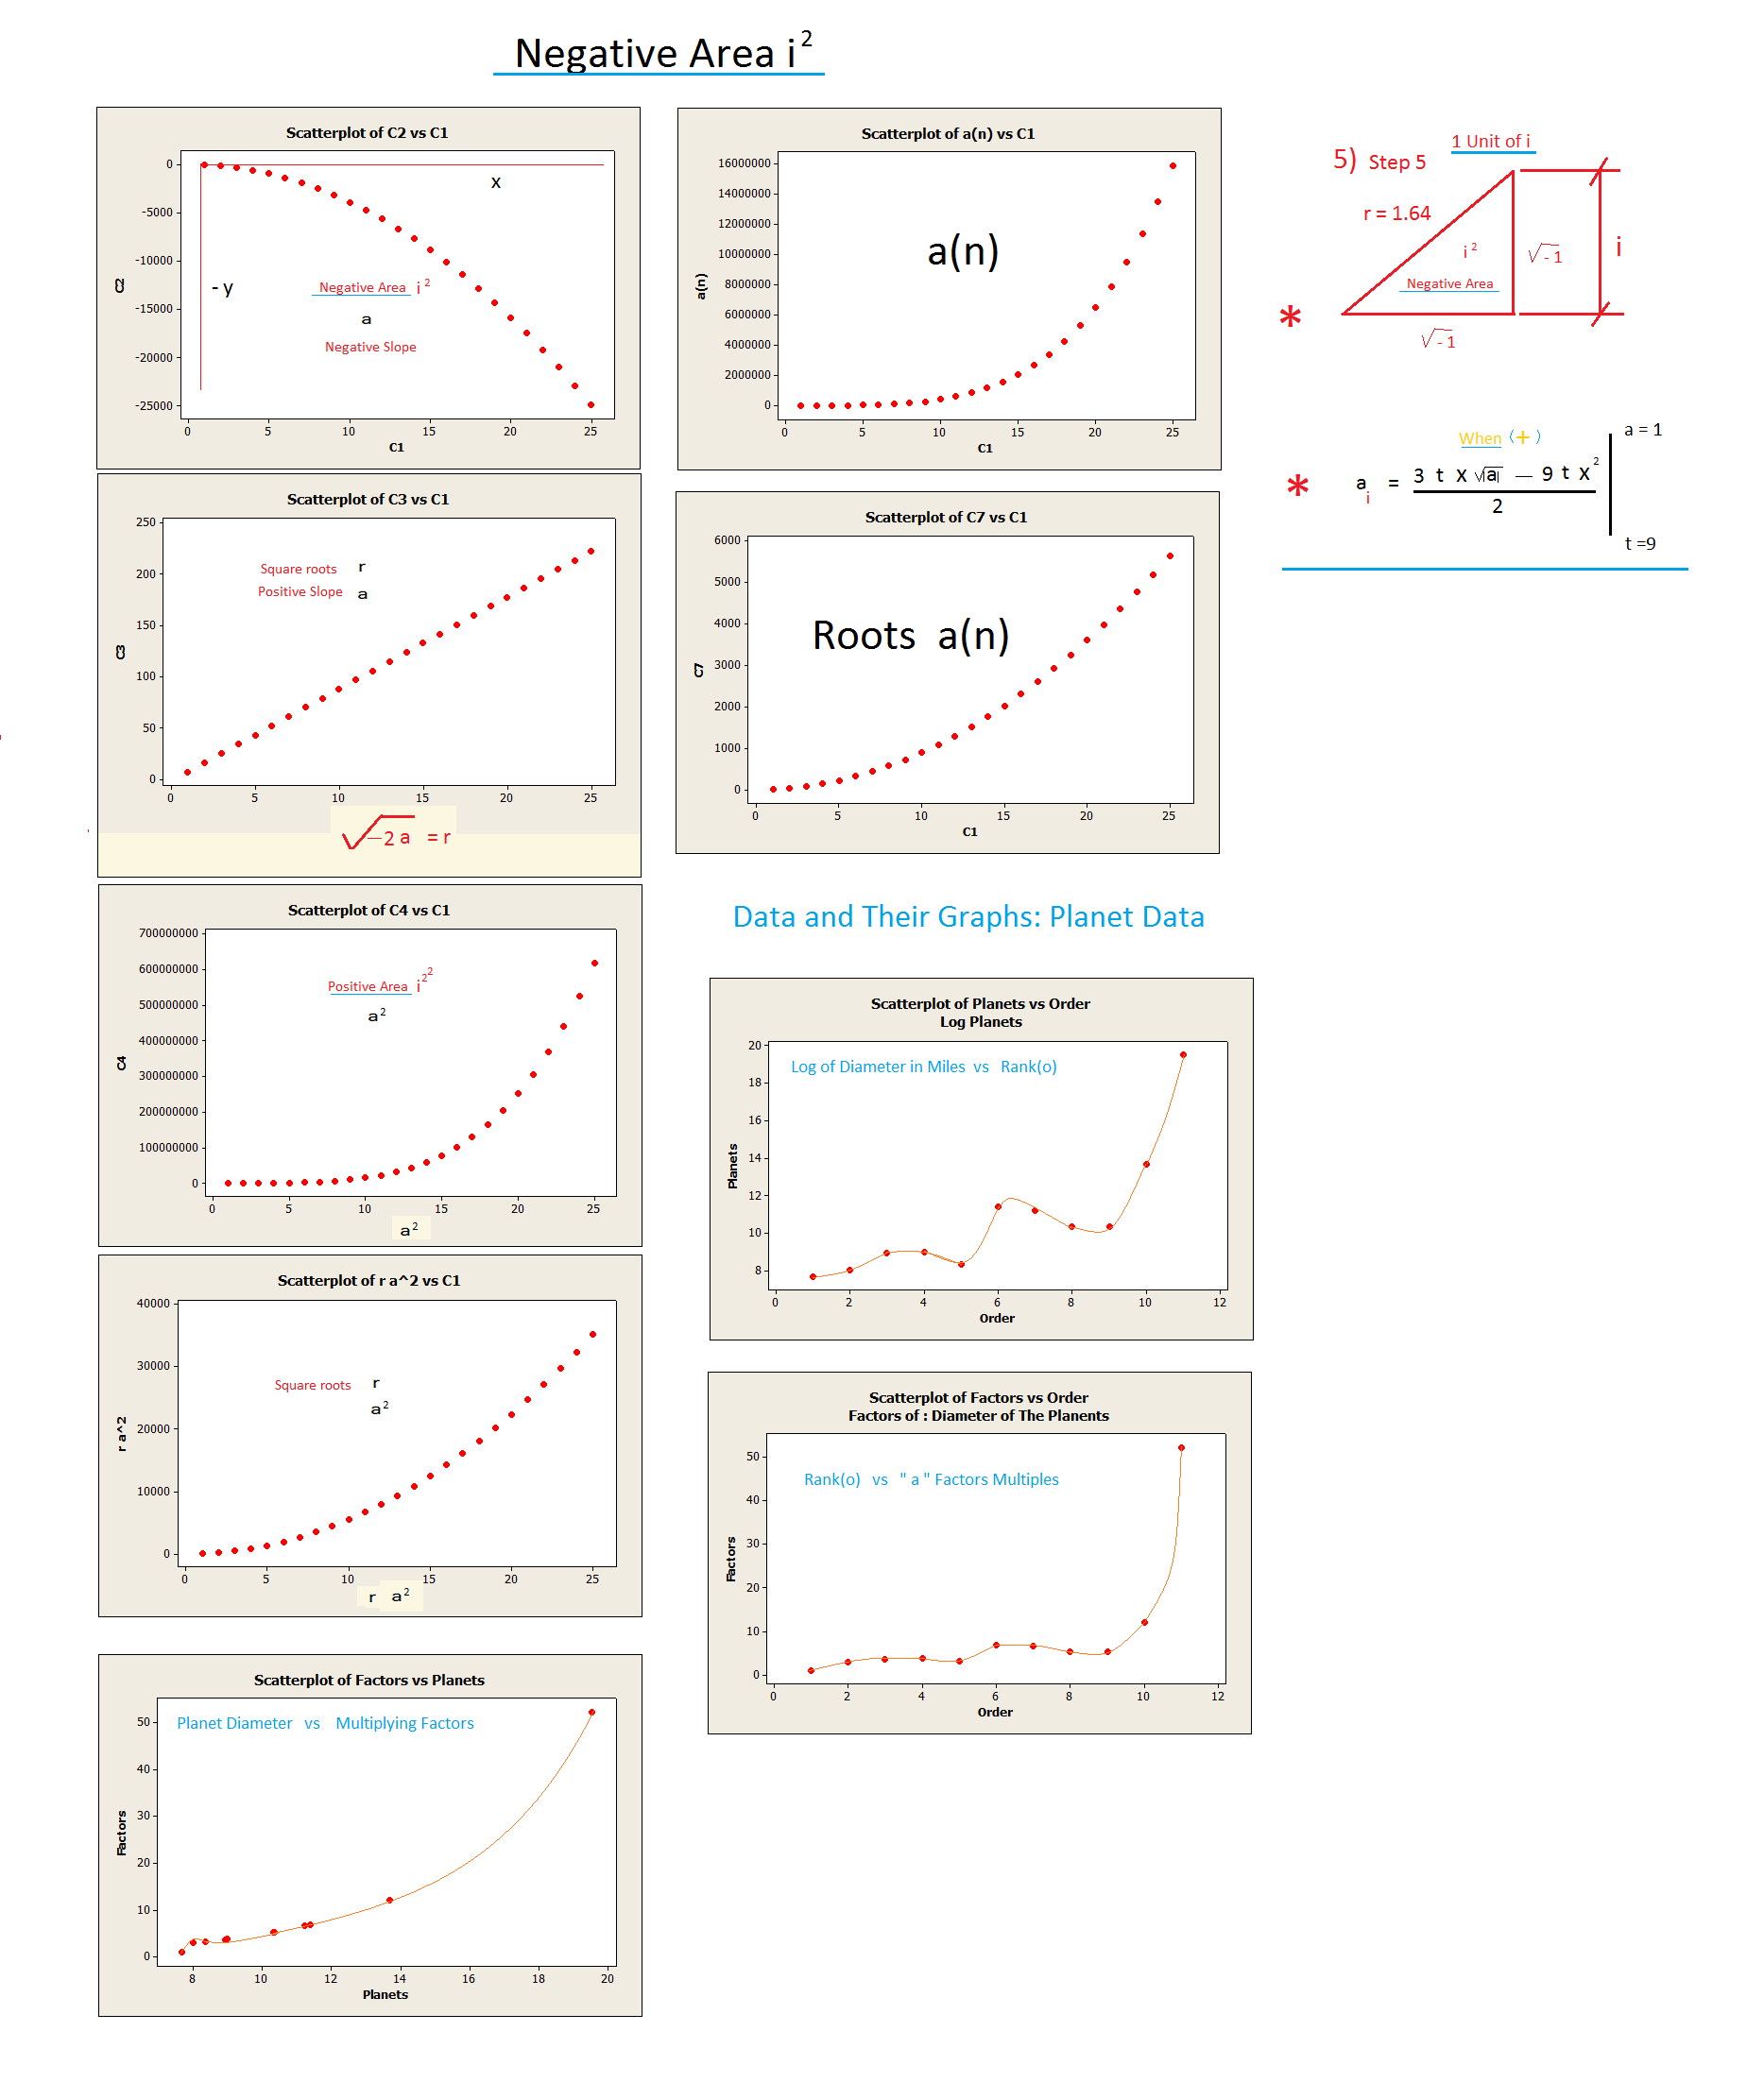
This example demonstrates the relationship between complex number square roots and negative area through graphical methods. It involves core mathematical concepts such as complex number operations, function graphs, integration, and geometric constructions. The construction uses GeoGebra commands/objects A, B, pic1 for drawing and display. Suitable for high school mathematics students and teachers to understand the application of complex numbers and geometry.
GeoGebra Commands & Parameters
Point A(-0.7439477224678086, -16.234630982125697)Point B(16.29605227753219, -16.234630982125697)
AI Drawing Prompt Reference
Draw the relationship between complex number square roots and negative area. First, create point A at (-0.74, -16.23) and point B at (16.29, -16.23), then use these points to illustrate the concept of complex number square roots and represent negative area graphically.
The prompt above was compiled from the original drawing commands and is for reference only.