
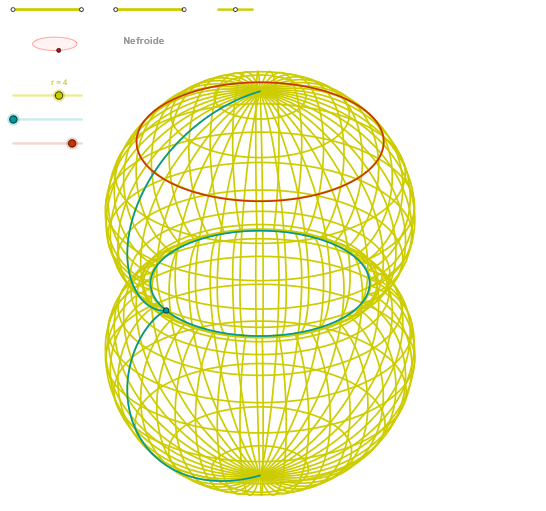
Nefroide: Linear Function and Ellipse Construction
Loading the math board and drawing, please wait…
In collections
geometriadinamica.es
This example demonstrates the relationship between linear functions and ellipses through geometric construction. Key mathematical concepts include linear functions, ellipse equations, and geometric construction methods. The construction involves GeoGebra commands such as Segment, Circle, Ellipse, and Intersect. Suitable for middle or high school mathematics education to understand the integration of functions and geometry.
GeoGebra Commands & Parameters
Segment(Q3, Q4) → p2Point(p2) → P3Segment(P3, Q4) → p4Point(p4) → P4Segment(Q1, Q2) → p1Point(p1) → P1Segment(P1, Q2) → p3Point(p3) → P2OrthogonalLine(C, xAxis) → zz2Circle(C, 0.62) → zz0Intersect(zz0, zz2, 1) → ZZ4Intersect(zz0, zz2, 2) → ZZ3Ellipse(ZZ3, ZZ4, 0.65) → zElipse2Point(zElipse2) → ZIntersect(zElipse2, zz2) → ZZ7, ZZ8Angle(ZZ8, C, Z) → zAngIncOrthogonalLine(C, yAxis) → zz1Intersect(zz0, zz1, 2) → ZZ2Intersect(zz0, zz1, 1) → ZZ1Ellipse(ZZ1, ZZ2, 0.65) → zElipse1Point(zElipse1) → XYIntersect(zElipse1, zz1) → ZZ5, ZZ6Angle(ZZ6, C, XY) → zAngRotSegment(Q5, Q6) → p5Point(p5) → P5Segment(ZZ5, ZZ6) → zz4Segment(ZZ7, ZZ8) → zz3Intersect(zElipse2, zElipse1, 1) → zPunto1Intersect(zElipse2, zElipse1, 4) → zPunto2Segment(zPunto1, zPunto2) → zSeg2CurveCartesian((r / 2.5 * (((cos(α) * ((3 * cos(v)) - cos((3 * v)))) * sin(zAngRot)) + ((sin(α) * ((3 * cos(v)) - cos((3 * v)))) * cos(zAngRot)))), (r / 2.5 * (((((-cos(α)) * ((3 * cos(v)) - cos((3 * v)))) * cos(zAngRot)) * sin(zAngInc)) + (((sin(α) * ((3 * cos(v)) - cos((3 * v)))) * sin(zAngRot)) * sin(zAngInc)) + (((3 * sin(v)) - sin((3 * v))) * cos(zAngInc)))), v, v1, v2) → curva2CurveCartesian((r / 2.5 * (((cos(u) * 2) * sin(zAngRot)) + ((sin(u) * 2) * cos(zAngRot)))), (r / 2.5 * (((((-cos(u)) * 2) * cos(zAngRot)) * sin(zAngInc)) + (((sin(u) * 2) * sin(zAngRot)) * sin(zAngInc)))), u, u1, u2) → curva1CurveCartesian((r / 2.5 * (((cos(u) * ((3 * cos(β - 3.14159 / 2)) - cos((3 * (β - 3.14159 / 2))))) * sin(zAngRot)) + ((sin(u) * ((3 * cos(β - 3.14159 / 2)) - cos((3 * (β - 3.14159 / 2))))) * cos(zAngRot)))), (r / 2.5 * (((((-cos(u)) * ((3 * cos(β - 3.14159 / 2)) - cos((3 * (β - 3.14159 / 2))))) * cos(zAngRot)) * sin(zAngInc)) + (((sin(u) * ((3 * cos(β - 3.14159 / 2)) - cos((3 * (β - 3.14159 / 2))))) * sin(zAngRot)) * sin(zAngInc)) + (((3 * sin(β - 3.14159 / 2)) - sin((3 * (β - 3.14159 / 2)))) * cos(zAngInc)))), u, u1, u2) → a1Sequence(CurveCartesian[(r / 2.5 * (((cos(u) * ((3 * cos(v)) - cos((3 * v)))) * sin(zAngRot)) + ((sin(u) * ((3 * cos(v)) - cos((3 * v)))) * cos(zAngRot)))), (r / 2.5 * (((((-cos(u)) * ((3 * cos(v)) - cos((3 * v)))) * cos(zAngRot)) * sin(zAngInc)) + (((sin(u) * ((3 * cos(v)) - cos((3 * v)))) * sin(zAngRot)) * sin(zAngInc)) + (((3 * sin(v)) - sin((3 * v))) * cos(zAngInc)))), u, u1, u2], v, v1, v2, paso) → list3Sequence(CurveCartesian[(r / 2.5 * (((cos(u) * ((3 * cos(v)) - cos((3 * v)))) * sin(zAngRot)) + ((sin(u) * ((3 * cos(v)) - cos((3 * v)))) * cos(zAngRot)))), (r / 2.5 * (((((-cos(u)) * ((3 * cos(v)) - cos((3 * v)))) * cos(zAngRot)) * sin(zAngInc)) + (((sin(u) * ((3 * cos(v)) - cos((3 * v)))) * sin(zAngRot)) * sin(zAngInc)) + (((3 * sin(v)) - sin((3 * v))) * cos(zAngInc)))), v, v1, v2], u, u1, u2, paso) → list1
AI Drawing Prompt Reference
Draw a geometric illustration showing the relationship between linear functions and ellipses. Start by constructing two line segments and two points. Then, draw a circle with one point as the center and intersect it with a line perpendicular to the x-axis to get two points. Use these points to draw an ellipse. Next, draw another circle with the other point as the center, intersect it with the same perpendicular line to get two more points, and draw another ellipse. Finally, connect the intersection points of the two ellipses and plot two curves to demonstrate the integration of functions and geometry.
The prompt above was compiled from the original drawing commands and is for reference only.