
Mr. Gray's Function Graph and Data Analysis Example
Loading the math board and drawing, please wait…
In collections
CCSS IP Math I Unit 4 Lesson 3
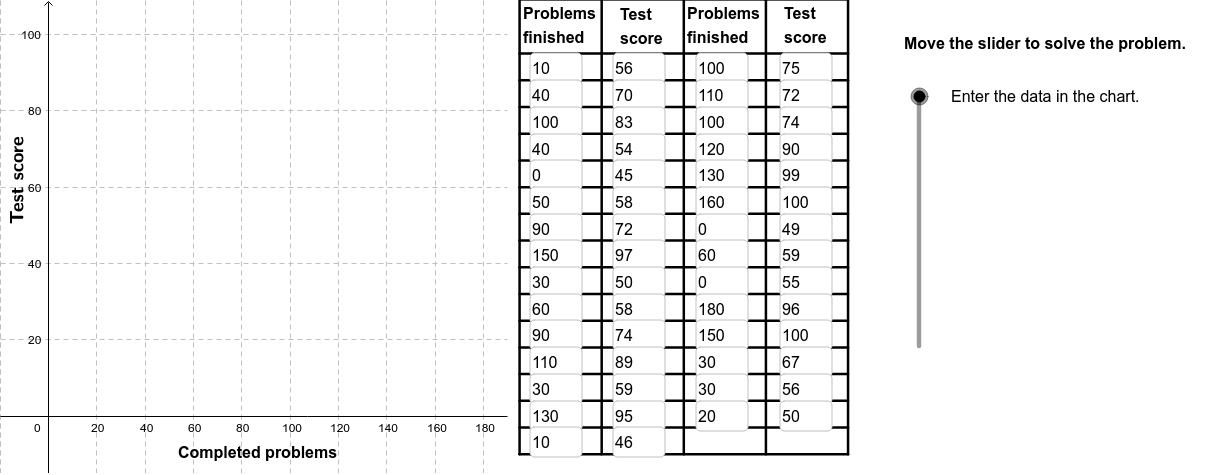
This example demonstrates how function graphs can help students understand the impact of study habits on exam performance. Key mathematical concepts include function graphs, scatter plots, and logical reasoning. Construction involves commands like FitLineY, PMCC, and Textfield to draw function lines, calculate correlation coefficients, and label data points. Suitable for high school students for function graph analysis and data visualization practice.
GeoGebra Commands & Parameters
FitLineY(PointList1) → LineFitPMCC(PointList1) → CorCoeffTextfield(A2) → InA2Textfield(A3) → InA3Textfield(A4) → InA4Textfield(A5) → InA5Textfield(A6) → InA6Textfield(A7) → InA7Textfield(A8) → InA8Textfield(A9) → InA9Textfield(A10) → InA10Textfield(A11) → InA11Textfield(A12) → InA12Textfield(A13) → InA13Textfield(A14) → InA14Textfield(A15) → InA15Textfield(A16) → InA16Textfield(A17) → InA17Textfield(A18) → InA18Textfield(A19) → InA19Textfield(A20) → InA20Textfield(A21) → InA21Textfield(B2) → InB2Textfield(B3) → InB3Textfield(B4) → InB4Textfield(B5) → InB5Textfield(B6) → InB6Textfield(B7) → InB7Textfield(B8) → InB8Textfield(B9) → InB9Textfield(B10) → InB10Textfield(B11) → InB11Textfield(B12) → InB12Textfield(B13) → InB13Textfield(B14) → InB14Textfield(B15) → InB15Textfield(B16) → InB16Textfield(B17) → InB17Textfield(B18) → InB18Textfield(B19) → InB19Textfield(B20) → InB20Textfield(B21) → InB21Polygon((190, y(Corner[1])), Corner[2], Corner[3], (190, y(Corner[4]))) → poly1, a, b, c, dTextfield(A22) → InA22Textfield(A23) → InA23Textfield(A24) → InA24Textfield(A25) → InA25Textfield(A26) → InA26Textfield(B22) → InB22Textfield(B23) → InB23Textfield(B24) → InB24Textfield(B25) → InB25Textfield(B26) → InB26Textfield(A27) → InA27Textfield(A28) → InA28Textfield(A29) → InA29Textfield(A30) → InA30Textfield(B27) → InB27Textfield(B28) → InB28Textfield(B29) → InB29Textfield(B30) → InB30Sequence(Segment[(195, (-10) + (7 * i)), (331, (-10) + (7 * i))], i, 0, 15) → Linesh1Sequence(Segment[(195 + (34 * i), (-10)), (195 + (34 * i), 109)], i, 0, 4) → Linesv1Segment((195, 109), (331, 109)) → top1RotateText("Test score", 90*°) → SideLegend
AI Drawing Prompt Reference
Draw a function graph showing y = f(x) with data points representing exam scores and study habits. Use FitLineY to fit the function line, PMCC to calculate the correlation coefficient, and label data points and coefficients with text. The graph should clearly show the function line and data points to help understand the impact of study habits on exam performance.
The prompt above was compiled from the original drawing commands and is for reference only.