
Moving Plane Intersections with Surface z=f(x,y)
Loading the math board and drawing, please wait…
In collections
intersection: surface-surface, curve-curve
intersection: surface-surface, curve-curve
intersection: surface-surface, curve-curve
intersection: surface-surface, curve-curve
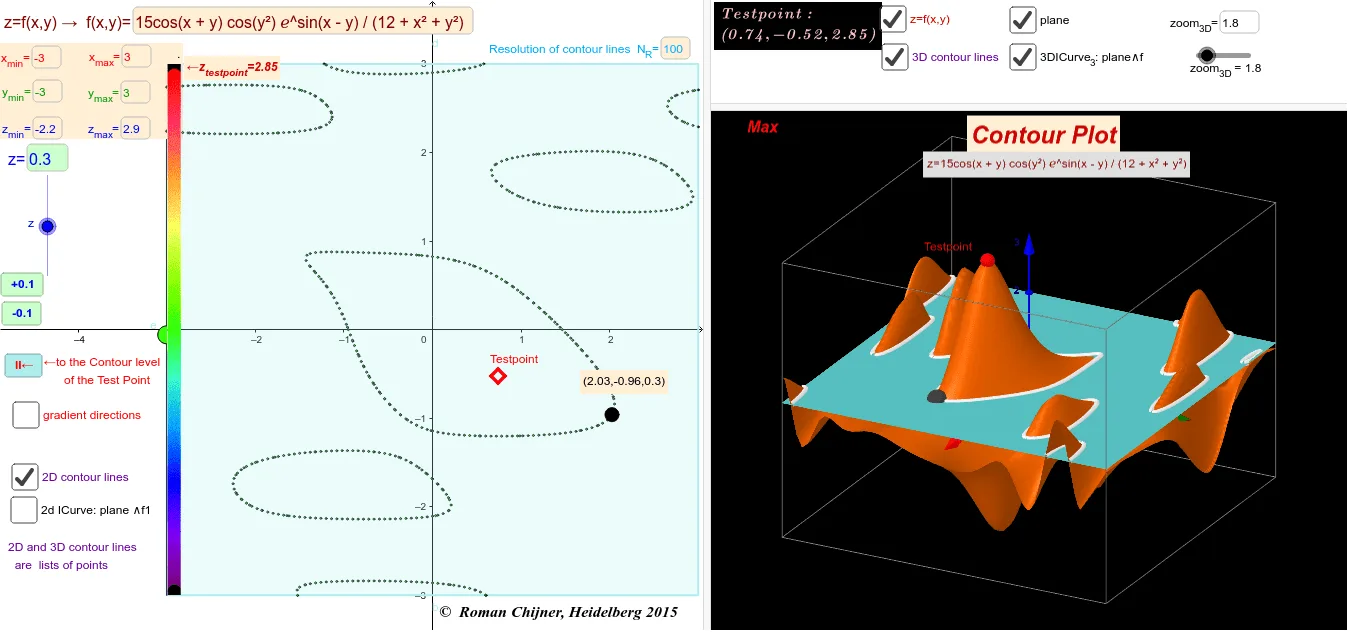
This example demonstrates how the intersection curve of a 3D surface z=f(x,y) changes when a plane moves through the surface. It covers multivariable functions, spatial surfaces, plane-surface intersections, cross-section curves, level curves, sampling, and parametric visualization. The construction uses Function to define f, ImplicitCurve, IntersectPath, and PointIn to generate or filter intersection paths and points, and If, Point, Segment, PolyLine, Polygon, Zip, Sequence, Sum, Length, RemoveUndefined, and Append to organize conditions, sample points, paths, and polygonal outlines. Objects such as z0, z_min, z_max, z_Step, N_P, N_C, x_min, x_max, y_min, y_max, Pxy, P1xxy, P2yyx, B01, B02, a, b, c, d, e, and y0 control domain bounds, step size, point counts, and plane position, while Textfield, inputBox2, inputBox3, button1, button2, button5, v_1, text1, and text2 provide interactive input and animation controls. It is suitable for advanced high-school mathematics, university multivariable calculus, analytic geometry, and GeoGebra 3D modeling demonstrations.
GeoGebra Commands & Parameters
If(Length[RemoveUndefined[Join[Zip[Mirror[{Roots[f0(a, x), y_{min}, y_{max}]}, y = x] + (a, 0), a, Sequence[x_{min} + ((x_{max} - x_{min}) / N_P * i), i, 0, N_P]]]]] ≟ 0, false, true) → lb1If(lb1, RemoveUndefined[Join[Zip[Mirror[{Roots[f0(a, x), y_{min}, y_{max}]}, y = x] + (a, 0), a, Sequence[x_{min} + ((x_{max} - x_{min}) / N_P * i), i, 0, N_P]]]], Sequence[(10000, 10000), k, 1, 50]) → P1xxyIf(lb1, RemoveUndefined[Join[Zip[Reverse[{Roots[f0(x, a), x_{min}, x_{max}]}] + (0, a), a, Sequence[y_{min} + ((y_{max} - y_{min}) / N_P * i), i, 0, N_P]]]], Sequence[(10000, 10000), k, 1, 50]) → P2yyxPolygon((x_{min}, y_{min}), (x_{max}, y_{min}), (x_{max}, y_{max}), (x_{min}, y_{max})) → poly1, b, c, d, ePointIn(poly1) → PTestZip((x(a), y(a), z0), a, Join[{P1xxy, P2yyx}]) → list1Segment(B02, B01) → aTextfield(v_1) → inputBox2Textfield(f) → inputBox3Textfield(x_{min}) → inputBox4Textfield(x_{max}) → inputBox5Textfield(y_{max}) → inputBox6Textfield(z_{max}) → inputBox7Textfield(y_{min}) → inputBox8Textfield(z_{min}) → inputBox9Point(a, 1 - zzii_B) → ATextfield(N_P) → inputBox10Sum(Sequence[If[f(x(PTest), y(PTest)) - f(x(Element[lr01, i]), y(Element[lr01, i])) > 0, 1, 0], i, 1, n]) → ext1Length(list1) → LäTextfield(step) → inputBox12Textfield(zoom_{3D}) → InputBox1Sequence((x(Element[lr01, i]), y(Element[lr01, i]), f(x(Element[lr01, i]), y(Element[lr01, i]))), i, 1, n) → lr013Sequence((x(Element[lr02, i]), y(Element[lr02, i]), f(x(Element[lr02, i]), y(Element[lr02, i]))), i, 1, n) → lr023RemoveUndefined(Sequence[If[f(x(PTest), y(PTest)) - f(x(Element[lr01, i]), y(Element[lr01, i])) > 0, i, NaN], i, 1, n]) → lr04Zip(Vector[b, a], a, Sequence[Element[lr01, Element[lr04, i]], i, 1, Length[lr04]], b, Sequence[Element[lr02, Element[lr04, i]], i, 1, Length[lr04]]) → lr06Zip(Vector[b, a], a, Sequence[Element[lr013, Element[lr04, i]], i, 1, Length[lr04]], b, Sequence[Element[lr023, Element[lr04, i]], i, 1, Length[lr04]]) → lr063Zip(Vector[a, b], a, Sequence[Element[lr01, Element[lr05, i]], i, 1, Length[lr05]], b, Sequence[Element[lr02, Element[lr05, i]], i, 1, Length[lr05]]) → lr07Zip(Vector[a, b], a, Sequence[Element[lr013, Element[lr05, i]], i, 1, Length[lr05]], b, Sequence[Element[lr023, Element[lr05, i]], i, 1, Length[lr05]]) → lr073RemoveUndefined(Sequence[If[f(x(PTest), y(PTest)) - f(x(Element[lr01, i]), y(Element[lr01, i])) > 0, i, (-i)], i, 1, n]) → lr04cAppend(lr04c, Element[lr04c, 1]) → lr04ccSum(Sequence[If[(Element[lr04cc, i] * Element[lr04cc, i + 1]) < 0, 1, 0], i, 1, n + 1]) → lr04cccIf(ext1 ≟ n, "Max", If[ext1 ≟ 0, "Min", If[(lr04ccc > 2) ∧ (lr04ccc ≤ 4), "saddle ? ", "?"]]) → TT1PolyLine({(0, 0.5019607843), (0.1, 0.4980392157), (0.2, 0), (0.3, 0), (0.4, 0.2), (0.5, 0.2), (0.7, 1), (1, 1)}) → RoPolyLine({(0, 0), (0.2, 0), (0.3, 0.6), (0.4, 1), (0.7, 1), (0.9, 0.2), (1, 0)}) → GrPolyLine({(0, 0.5019607843), (0.1, 1), (0.3, 1), (0.4, 0.8), (0.5, 0), (0.6, 0), (0.7, 0.4), (0.8, 0.2), (0.9, 0.4), (1, 0)}) → BlFunction(f(a, b), a, x_{min} - 0.2, x_{max} + 0.2, b, y_{min} - 0.2, y_{max} + 0.2) → gPoint(Pxy) → DTextfield(z0) → InputBox2ImplicitCurve(g(x, y) - z0) → pIntersectPath(o, g(x, y)) → s
AI Drawing Prompt Reference
Visualize a 3D surface defined by the function z=f(x,y) and show how the intersection curve changes as a plane moves through the surface. The plot should include the 3D view of the surface, the path of the moving plane, and the intersection curve, allowing users to manipulate the function, surface bounds, and plane position using sliders and input fields to explore multivariable functions, spatial surfaces, and plane-surface intersections.
The prompt above was compiled from the original drawing commands and is for reference only.