
Moving Functions: Graph Transformations with Coordinates
Loading the math board and drawing, please wait…
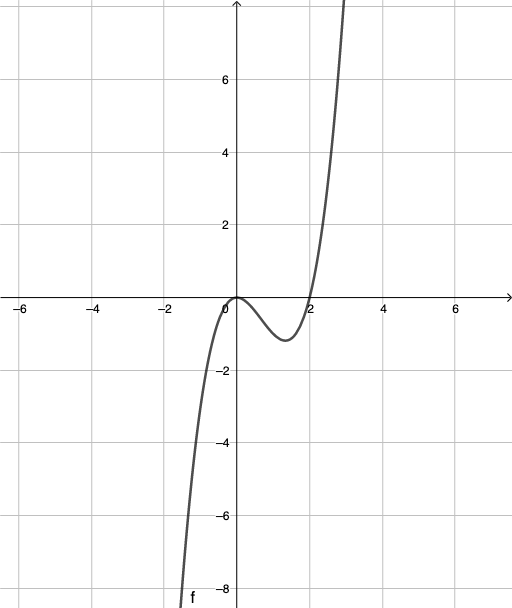
This example demonstrates how “moving functions” changes the graph in the coordinate plane: when a function is translated or adjusted according to a transformation rule, its graph shifts accordingly while preserving the overall shape correspondence. Key mathematical ideas include function graph transformations (translation/movement), coordinate-geometry interpretation, and the notion of congruence/corresponding figures under rigid transformations. From the construction summary (“objects: f”), the construction centers on defining or using a function object f as the primary object to be moved, then applying the intended transformation to generate and visualize the moved graph and its relation to the original. Suitable for middle-school algebra and coordinate-geometry instruction, and useful for interactive classroom demos where students can explore how transformation rules produce predictable graph movement.
GeoGebra Commands & Parameters
f(x) = (x^(2) * (x - 2))
AI Drawing Prompt Reference
In a coordinate plane, plot the graph of the function f(x)=x^2(x−2). First define the function relationship, then generate the corresponding curve within the same axes. Use this graph as the main object: its overall shape is determined by the polynomial expression, serving as an initial reference when illustrating the idea of “moving functions” via coordinate-based graph transformations.
The prompt above was compiled from the original drawing commands and is for reference only.