
Moving Average - Rolling Average, Running Average
Loading the math board and drawing, please wait…
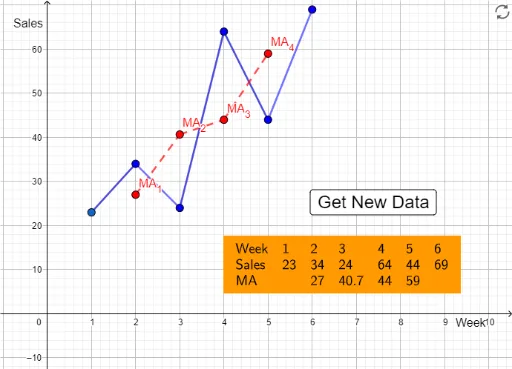
This example demonstrates the calculation and visualization of Moving Average (Rolling Average, Running Average) in time series data. It involves core mathematical concepts such as statistical characteristics, arithmetic mean, geometric mean, variance, logarithm, and geometric transformations. The construction utilizes GeoGebra commands like Random, Segment, TableText, and objects including buttons (button1, a, F, E, D, A, B, C, c, MA_{1}, d, MA_{2}, l1, l2, g, h, i, j, e, MA_{3}, f, MA_{4}, k, l, m, n, l3, l4, l5, text1, text2, text3, text4). It is suitable for high school students and data analysis enthusiasts to learn the calculation methods and practical applications of moving averages.
GeoGebra Commands & Parameters
Random(-2, 7) → aSegment(B, C) → gSegment(C, D) → hSegment(D, E) → iSegment(E, F) → jSegment(A, B) → kSegment(MA_{1}, MA_{2}) → lSegment(MA_{2}, MA_{3}) → mSegment(MA_{3}, MA_{4}) → nTableText(l3, l4, l5) → text1