
Edexcel Large Data Set - Histogram
Loading the math board and drawing, please wait…
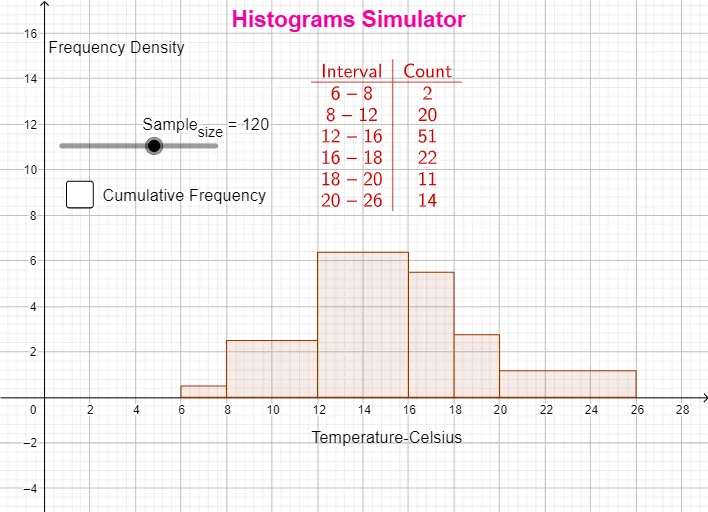
This example demonstrates how to visualize large datasets using histograms. The key mathematical concepts involve frequency distribution and statistical analysis. Construction involves GeoGebra commands like First, Text, FrequencyTable, and Histogram, along with objects such as lhr, Sample_{size}, lhr1, text2, text3, text1, b, text4, a, text5. Suitable for high school students or beginners in statistics.
GeoGebra Commands & Parameters
First(lhr, Sample_{size}) → lhr1Text("Frequency Density") → text2Text("Temperature-Celsius") → text3FrequencyTable(false, {6, 8, 12, 16, 18, 20, 26}, lhr1) → text1Histogram({6, 8, 12, 16, 18, 20, 26}, lhr1, true, 0.5) → bFrequencyTable(true, {6, 8, 12, 16, 18, 20, 26}, lhr1) → text4
AI Drawing Prompt Reference
Create a histogram to visualize a large dataset’s frequency distribution. Use the data values {6, 8, 12, 16, 18, 20, 26} as the sample set. Add labels with the text “Frequency Density” and “Temperature-Celsius”. Construct the histogram from the same dataset in a frequency-density style, using an approximate bin width of 0.5. Then compute and display a corresponding frequency table based on the same values to match the histogram’s statistical interpretation.
The prompt above was compiled from the original drawing commands and is for reference only.