
More Dice (Simulation)
Loading the math board and drawing, please wait…
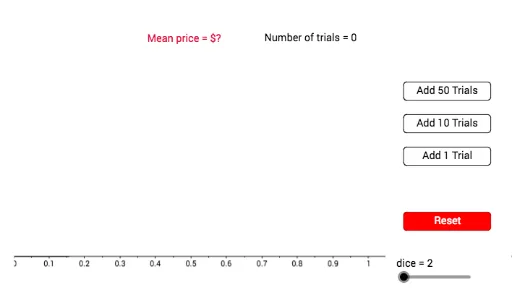
This example demonstrates the statistical distribution of results from simulating multiple dice rolls. Key math concepts include Random Experiments, Geometric Distribution, Real Numbers, Area, and Cube. Construction highlights involve commands/objects like Sequence, Random, Polygon, Point, BoxPlot, Sort, and DotPlot from GeoGebra; suitable for high school students learning Probability & Statistics.
GeoGebra Commands & Parameters
Sequence(Random[1, 6], a, 1, dice) → list3Random(1, 6) → d1Random(1, 6) → d2Polygon(A, B, C, D) → poly1, a, b, c, dPoint(f) → EBoxPlot(5, 0.25, prices) → eBoxPlot(5, 0.25, prices) → gRandom(1, 6) → d3Sort(list3) → list2DotPlot(prices, false, 0.05) → list1