
Module 18 HW: Exponential Functions, Rotation Transformations, and Stochastic Pr
Loading the math board and drawing, please wait…
① This example demonstrates the graphing of an exponential function, the dynamic effect of a geometric rotation transformation, and a simple simulation of a stochastic process. ② Core mathematical concepts include exponential functions, arithmetic mean and ratios, rotation (geometric transformation), and fundamentals of random processes / probability statistics. ③ Construction highlights: a GeoGebra `Function` object `f` defines the exponential function; the `Rotate` command animates rotation about a point; `Random` or `Sequence` generates random data points to illustrate the stochastic process; sliders control parameters for interactive exploration. ④ Suitable for high‑school “functions and transformations” lessons, introductory university probability/statistics demos, and as a GeoGebra modeling exercise.
GeoGebra Commands & Parameters
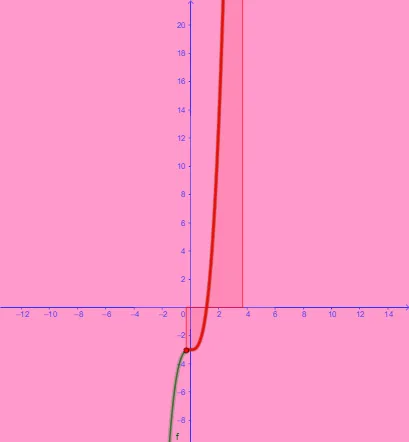
f: y = (2 * x^(3)) - 3
AI Drawing Prompt Reference
Draw an exponential-type function graph defined by the equation y = 2·x^3 − 3. Use a standard coordinate plane with axes for x and y. First specify the function relationship, then plot the curve over a reasonable x-range so the graph shows the expected growth/change as x increases, reflecting the vertical shift downward by 3 and the scaling effect of the coefficient 2 on the curve’s shape.
The prompt above was compiled from the original drawing commands and is for reference only.