
Modelling with a Sine Graph
Loading the math board and drawing, please wait…
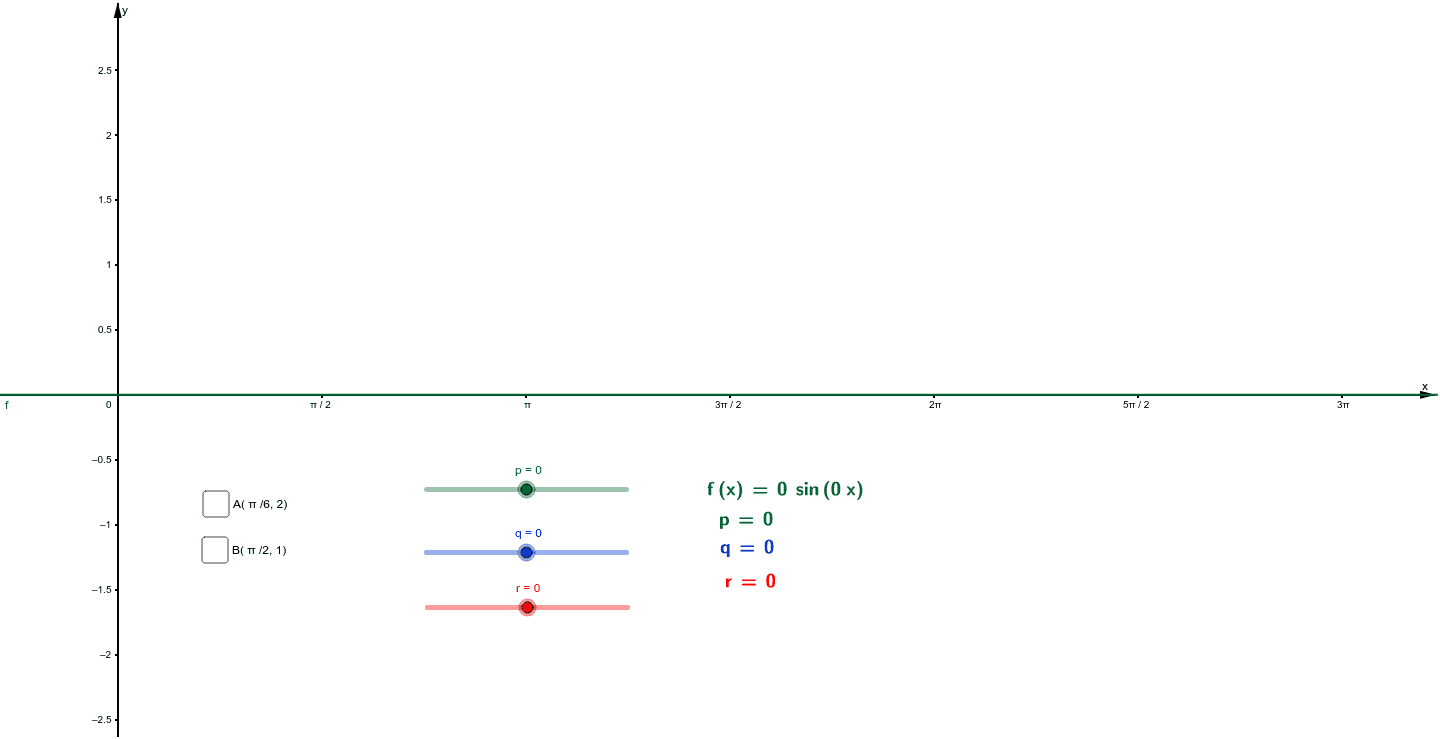
This example demonstrates how to use a sine graph for mathematical modelling, showcasing its practical applications. Core math concepts include sine functions, coordinate systems, graph plotting, and parameter transformations. It utilizes GeoGebra commands and objects like p, q, r, f, text1, text2, etc., for constructing the function graph, adding annotations, and adjusting parameters. Suitable for high school students learning function modelling and understanding the geometric meaning and real-world use of sine functions.
GeoGebra Commands & Parameters
LaTeX(f, true, true) → text1LaTeX(p, true, true) → text2LaTeX(q, true, true) → text3LaTeX(r, true, true) → text4LaTeX(f, true, true) → text5LaTeX(p, true, true) → text6LaTeX(q, true, true) → text7LaTeX(r, true, true) → text8
AI Drawing Prompt Reference
Draw a sine function graph and label its parameters and formula to demonstrate the application of sine functions in mathematical modeling. Include annotated text for multiple parameters, the sine function graph, and its formula, with clear relationships between parameters. The layout should be clear, suitable for showcasing the geometric meaning and real-world use of sine functions.
The prompt above was compiled from the original drawing commands and is for reference only.