
Milk in a Tetrahedron: Dynamic Volume and Integral Visualization
Loading the math board and drawing, please wait…
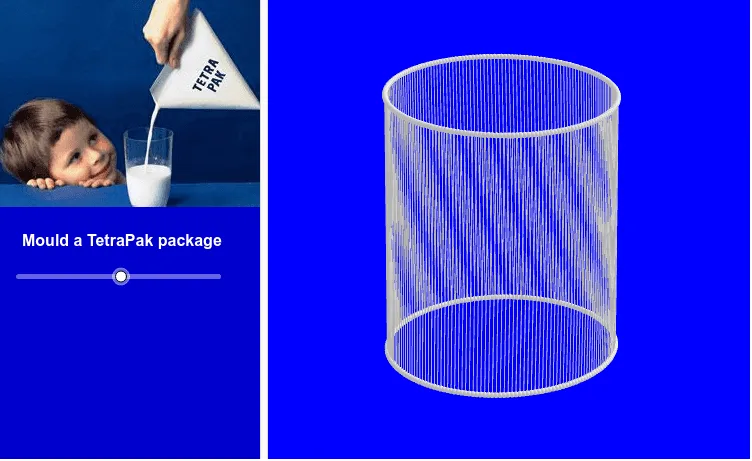
This GeoGebra example demonstrates how the volume of liquid ('milk') inside a tetrahedral container changes as the liquid level rises, providing an intuitive visualization of volume accumulation. The core mathematical concepts involve solid geometry (tetrahedron volume), integral calculus (summing thin slices to obtain total volume), and the relationship between function graphs and slopes. Construction highlights: using GeoGebra commands such as Intersect, Point, Circle, ApplyMatrix, Sequence, Vector, Translate, and Rotate to build the tetrahedron base and apex, generate horizontal cross-section slices, and animate the filling process. Lists (list1, list2, etc.) manage multiple slice layers, while a slider (α) controls the liquid height, and text objects display the computed volume. Suitable for high school to undergraduate students learning solid geometry and integral applications, and useful as an interactive teaching tool for volume calculations in mathematics labs.
GeoGebra Commands & Parameters
Intersect(xAxis, yAxis) → APoint(yAxis) → BCircle(A, B) → cApplyMatrix(M, c) → c'Sequence(Rotate[B, (π * n / 96), A], n, 0, 192) → list1ApplyMatrix(M, list1) → list1'Vector(A, (0, 0, 4.7)) → uTranslate(list1, u) → list2ApplyMatrix(M1, list2) → list2'Sequence(Segment[Element[list1', n], Element[list2', n]], n, 1, 193) → list3Rotate(list1', α, zAxis) → list1''Rotate(list2', α, zAxis) → list2''Rotate(list3, α, zAxis) → list3'