
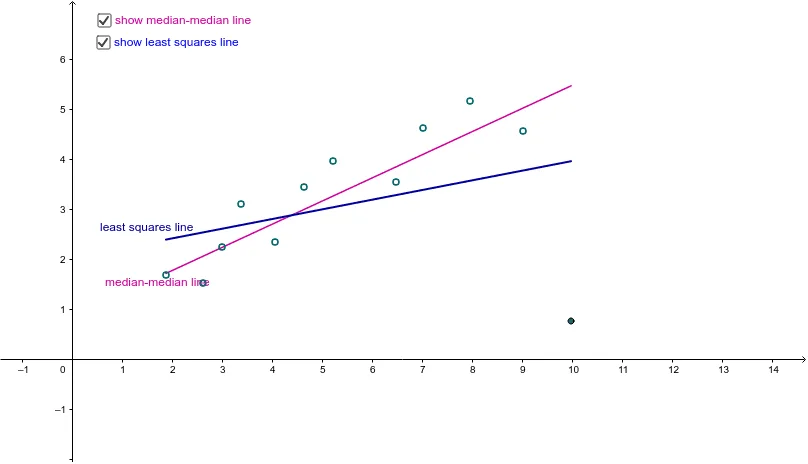
Median Median with Least Squares
Loading the math board and drawing, please wait…
In collections
Statistical Intuition Builders
This example demonstrates how to construct a least squares regression line using medians and medians. It involves core mathematical concepts like correlation, median value, centroid or barycenter, normal distribution, surface, pyramid, and function graph. The construction uses GeoGebra commands and objects such as Sort, Length, Sequence, Function, and FitLineY. Suitable for high school and above students to understand data fitting and geometric construction.
GeoGebra Commands & Parameters
Sort({A, B, C, D, E, F, G, H, I, J, K, L}) → ptsLength(pts) → nSequence(y(Element[pts, k]), k, 1, n) → yListSequence(x(Element[pts, k]), k, 1, n) → xListFunction((m * x) + b, Min[xList], Max[xList]) → mLineFitLineY(pts) → lsLineFunction((Slope[lsLine] * x) + y(Intersect[lsLine, yAxis]), Min[xList], Max[xList]) → lsLine2
AI Drawing Prompt Reference
Draw a linear regression line using medians and least squares, showing data points, median line, least squares line, and their relationships, first plot data points, then calculate the median line, fit the least squares line, and represent it with a function graph.
The prompt above was compiled from the original drawing commands and is for reference only.