
Median-Median Line vs LSRL for Three Points
Loading the math board and drawing, please wait…
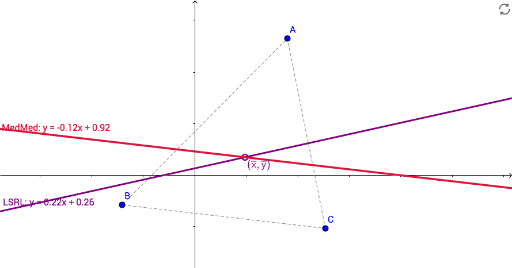
This example demonstrates the comparison between the Median-Median Line and Least Squares Regression Line on a dataset with three points. Key mathematical concepts include median, least squares regression, linear regression, convex hull, and centroid. GeoGebra commands used in construction are Centroid, ConvexHull, FitLineY, Sort, and Line. It is suitable for high school mathematics education to understand the characteristics and applicability of different linear models.
GeoGebra Commands & Parameters
Centroid(Polygon[{A, B, C}]) → MConvexHull({A, B, C}) → graph1FitLineY({A, B, C}) → LSRLSort({A, B, C}) → list1Line(M, Line[Element[list1, 1], Element[list1, 3]]) → MedMed
AI Drawing Prompt Reference
Create three points A, B, and C. Then find their centroid M, convex hull graph1, least squares regression line LSRL, and median-median line MedMed. First, create the three points, then calculate the centroid and convex hull, draw the least squares regression line, and finally, draw the median-median line using the centroid and two vertices of the convex hull.
The prompt above was compiled from the original drawing commands and is for reference only.