
Mean vs Median via Box Plot: A Descriptive Statistics Demo
Loading the math board and drawing, please wait…
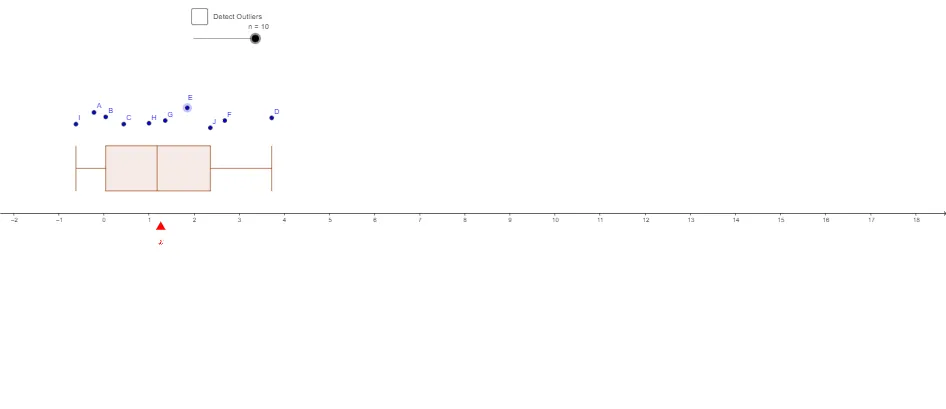
This example demonstrates how a box plot can be used to compare the mean and the median, highlighting what changes when data are skewed or include outliers. It centers on descriptive statistics concepts: the mean (mean), median/quantile meaning as reflected by box-plot positioning, the role of extrema (Min/Max), and the interpretation of the box-and-whisker components. Construction is carried out by generating data with Sequence, building the visualization with BoxPlot, computing the mean with mean, and obtaining minimum and maximum values using Min and Max. It also uses If for conditional logic such as filtering, grouping, or marking based on criteria. The provided construction structure (e.g., list and list3–list10, freq, boxplot_x, along with variables like J…A and K) supports storing datasets, frequencies, and mapping results into the plotting coordinates so numerical summaries and graphics update together. Suitable for middle school through early college, especially for lessons on probability & statistics and interpreting statistical summaries visually.
GeoGebra Commands & Parameters
Sequence(If[k ≤ n, 1, 0], k, 1, 10) → freqBoxPlot(-1, 0.5, list, freq, false) → bIf(n > 3, Append[list3, x(D)], list3) → list4If(n > 4, Append[list4, x(E)], list4) → list5If(n > 5, Append[list5, x(F)], list5) → list6If(n > 6, Append[list6, x(G)], list6) → list7If(n > 7, Append[list7, x(H)], list7) → list8If(n > 8, Append[list8, x(I)], list8) → list9If(n > 9, Append[list9, x(J)], list9) → list10BoxPlot(1, 0.5, list10, a) → boxplot_xmean(list10) → mSequence(17, 17, 0, InversePoisson[4, 0.999999]) →Min(x(Point[xAxis]) + 1.5, x(Point[xAxis]) + 1.5) →Max(x(Point[xAxis]) + 1.5, x(Point[xAxis]) + 1.5) →
AI Drawing Prompt Reference
Create a descriptive-statistics graphic on a coordinate plane using box plots to compare mean versus median-related positioning. Build a frequency-based dataset (via a stepwise conditional inclusion) and compute the mean of the same data. Draw a box-and-whisker plot showing the box region and whiskers corresponding to the data’s minimum and maximum, with the box placement reflecting quantile/median-related location. Then add a second box plot using the accumulated dataset so the mean’s relative position versus the box (median/quantile area) can be visually contrasted, with the plot updating as more values are appended.
The prompt above was compiled from the original drawing commands and is for reference only.