
Normal Distribution Curves and Area Calculation
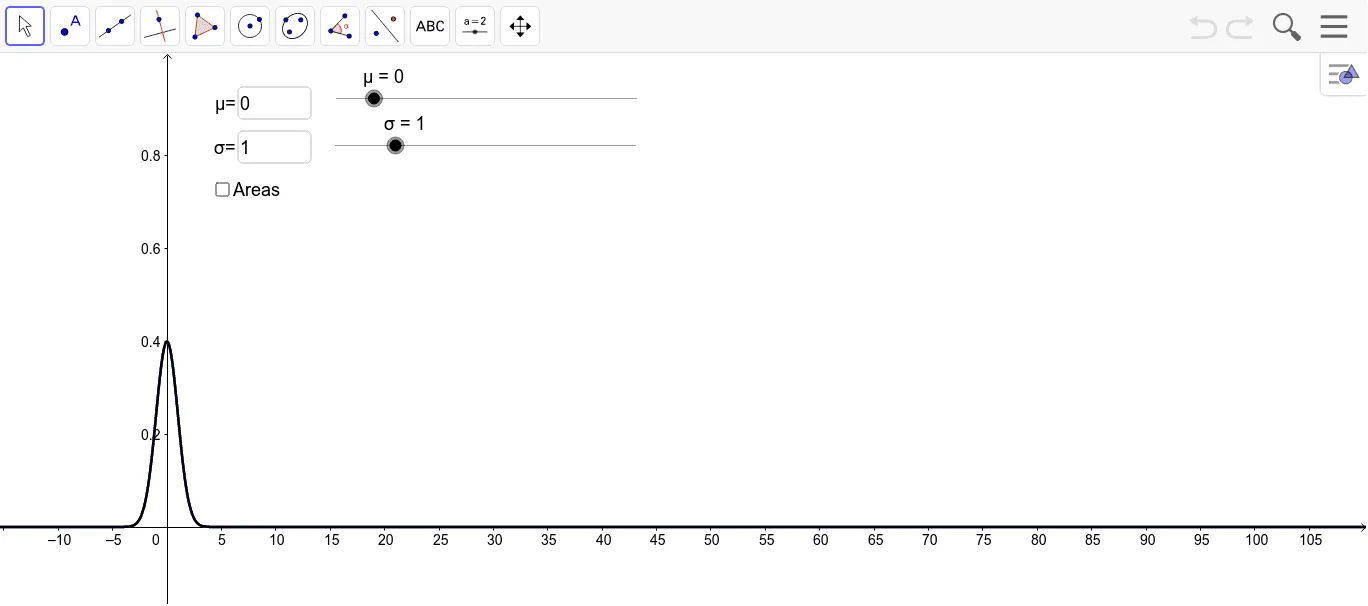
This GeoGebra applet demonstrates the probability density function curve of the normal distribution and the calculation of areas under the curve. Users can input specific values for the mean and standard deviation, dynamically observing how these parameters reshape the characteristic bell curve in real time. As the mean shifts, the curve translates left or right along the horizontal axis, while changes to the standard deviation stretch or compress the curve vertically, providing immediate visual feedback on how these fundamental parameters influence the distribution's spread and central tendency.
The applet integrates calculus tools that allow users to compute the area under the normal distribution curve over any selected interval. This area corresponds directly to the probability that a normally distributed random variable falls within that range. Students can select bounds interactively and watch the shaded region update instantly, reinforcing the connection between definite integrals and probabilistic interpretation.
A key feature of the applet is its support for standard normal distribution transformations. Users can convert any general normal distribution to the standard form using the Z-score formula, Z equals X minus mu divided by sigma, and then compute areas using the standard normal table framework built into the visualization. This helps learners see the practical relationship between arbitrary normal distributions and the standard normal distribution, a cornerstone concept in inferential statistics.
The applet is designed to help students build an intuitive understanding of several core topics in probability and statistics. It visually connects abstract formulas to concrete graphical representations, making it easier to grasp how probability density functions work, how areas under curves represent probabilities, and why the empirical rule applies to normal distributions. By manipulating parameters and observing outcomes simultaneously, learners develop a deeper conceptual foundation that supports both theoretical study and real-world applications of statistical reasoning.
Loading the math board and drawing, please wait…