
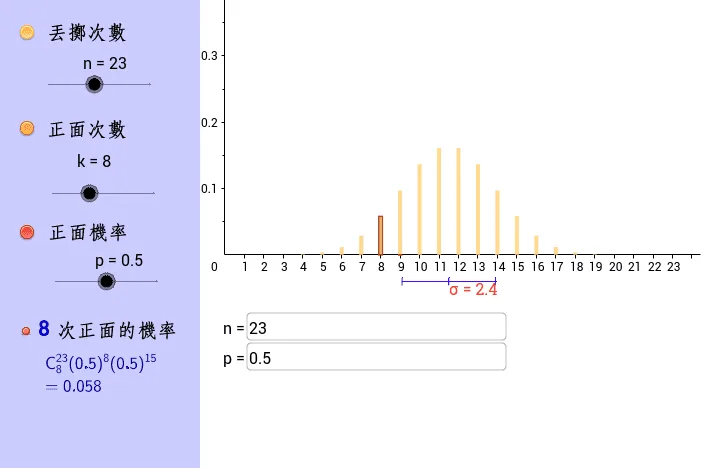
Interactive Binomial Distribution Bar Chart
This GeoGebra example visualizes binomial probability via dynamic bar charts that update with parameter changes. Core concepts include the binomial probability formula, symmetry, expectation, and variance. Construction uses Sequence to generate terms, BarChart for probability bars, and Segment for labels, with sliders controlling p, q, n, and k. Ideal for high-school probability lessons and introductory college statistics to help learners explore binomial distribution properties interactively.
Loading the math board and drawing, please wait…