
Mean Value Theorem: Quick Intuitive Tests by Tim Brzezinski
Loading the math board and drawing, please wait…
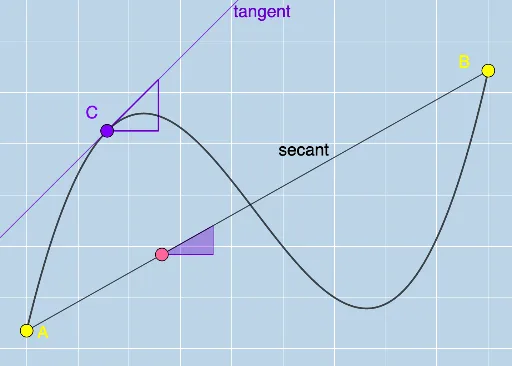
This example demonstrates the Mean Value Theorem intuitively by showing graphically that the average rate of change of a function over an interval equals the instantaneous rate of change at a point within that interval. Key math concepts include derivatives, secant lines, tangent lines, and similar triangles. GeoGebra commands and objects like Point, FitPoly, Line, Slope, Dilate, Vector, Translate, and Segment are used to construct function graphs, secant and tangent lines, and related geometric figures. Suitable for high school and above students learning calculus to understand the geometric meaning of the Mean Value Theorem.
GeoGebra Commands & Parameters
Point(x = 0) → APoint(x = 6) → C_1Point(x = 3) → B_1Point(x = 9) → BFitPoly({A, B_1, C_1, B}) → fPoint(g) → CLine(A, B) → hPoint(Segment[A, B]) → FSlope(Line[F, A]) → aPoint(eq1) → GSlope(Line[C, G]) → bDilate(F, If[0 < c_1 ≤ 1, 1 - c_1, 0], C) → F'Vector(F, F') → uTranslate(h, u) → h'Point(h') → HSlope(Line[F', H]) → cSegment(A, B) → i
AI Drawing Prompt Reference
Draw a function graph and show the relationship between average and instantaneous rates of change. Mark three points on the x-axis and connect them to form a line. Find corresponding points on the function graph and draw a tangent line. Demonstrate the relationship between the tangent and the line using similar triangles and vectors, marking key points and segments.
The prompt above was compiled from the original drawing commands and is for reference only.