
Related Rates - The Sliding Ladder
Loading the math board and drawing, please wait…
In collections
AP Calculus AB Applet Collection
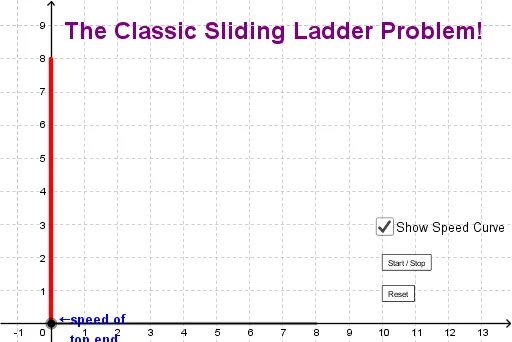
This interactive GeoGebra example demonstrates the classic related rates problem of a sliding ladder: a ladder leans against a wall, its base slides away from the wall at a constant speed, and the top slides down the wall, with the vertical velocity displayed in real time. The core mathematical concept is related rates in differential calculus, where the Pythagorean theorem constrains the ladder length, horizontal distance, and vertical height, and differentiating with respect to time yields the relationship between velocities. Construction details: the Circle command creates an auxiliary circle centered at the wall corner, Intersect finds the ladder's contact points with the wall and ground, Segment draws the ladder, and Function defines the velocity curve; sliders and buttons (btnReset, btnStart) control the animation, while a checkbox (chkShowSpeed) toggles the speed plot. Suitable for advanced high school or introductory college calculus students, this example helps visualize implicit differentiation and dynamic rates of change, and serves as an engaging classroom demonstration tool.
GeoGebra Commands & Parameters
Circle(A, 8.0001) → lIntersect(l, yAxis, 2) → BSegment(A, B) → ladderFunction(YVel, 0, dist) → PlotVel
AI Drawing Prompt Reference
Draw a right triangle representing a ladder leaning against a wall, with its base sliding along the ground. The ladder's length is fixed at 8.0001, and the moving speeds of the base and top are shown in real time. Use a circle to help locate the ladder's base and top, then draw a line segment for the ladder. Finally, draw a function curve to represent the top's speed.
The prompt above was compiled from the original drawing commands and is for reference only.