
Mean Value Theorem Demonstration by mrknauft
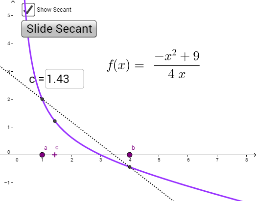
Loading the math board and drawing, please wait…
In collections
MVT for Derivatives
This example demonstrates the geometric interpretation of the Mean Value Theorem (MVT) in calculus, visually showing the parallelism between a tangent and a secant line within a function's interval. Key math concepts include derivatives, function graphs, intervals, tangent lines, secant lines, and limits. Construction highlights involve using GeoGebra commands like Line, OrthogonalLine, Intersect, Segment, Tangent, and Textfield to draw function graphs, tangents, secants, and intersection points. Suitable for high school and above mathematics learners for intuitive understanding of the theorem and its applications.
GeoGebra Commands & Parameters
Line(C_1, D) → secantLineOrthogonalLine(F, secantLine) → dIntersect(secantLine, d) → ESegment(E, F) → eLine(Point[e, p], secantLine) → slidingLineTangent(F, f) → tangentLineTextfield(c) → InputBox1
AI Drawing Prompt Reference
Draw a function graph, then draw a secant line within the interval and a tangent line at the endpoints. First, draw the function graph, then draw the secant line, find the intersection of the secant line and a perpendicular line, draw a segment connecting the intersection points, then draw the tangent lines at the endpoints of the interval, and finally add a text box to display key parameters.
The prompt above was compiled from the original drawing commands and is for reference only.