
Mean Value Theorem Illustrated by Tim Brzezinski
Loading the math board and drawing, please wait…
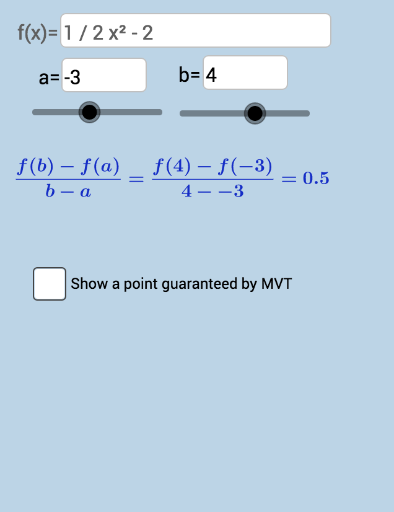
This example visually demonstrates the Mean Value Theorem, showing that the average rate of change of a continuous function over an interval equals the instantaneous rate of change at some point within that interval. Key math concepts include functions, derivatives, intervals, and slopes. Constructed using GeoGebra commands like Textfield, Line, Slope, FractionText, Root. Suitable for high school students and teachers learning calculus.
GeoGebra Commands & Parameters
Textfield(f) → InputBox1Textfield() → InputBox2Textfield(a) → InputBox3Line(A, B) → b_1Textfield(b) → InputBox4Slope(b_1) → iFractionText(i) → text1Slope(j) → kFractionText(k) → text3FractionText(x(A)) → text8FractionText(x(B)) → text9Root(p, x(A)) → EFractionText(Slope[c]) → text5Slope(j) → eSlope(b_1) → mSlope(c) → m_1Slope(b_1) → m_2