
Mean, Median, Mode, and Range by Auston B Cron
Loading the math board and drawing, please wait…
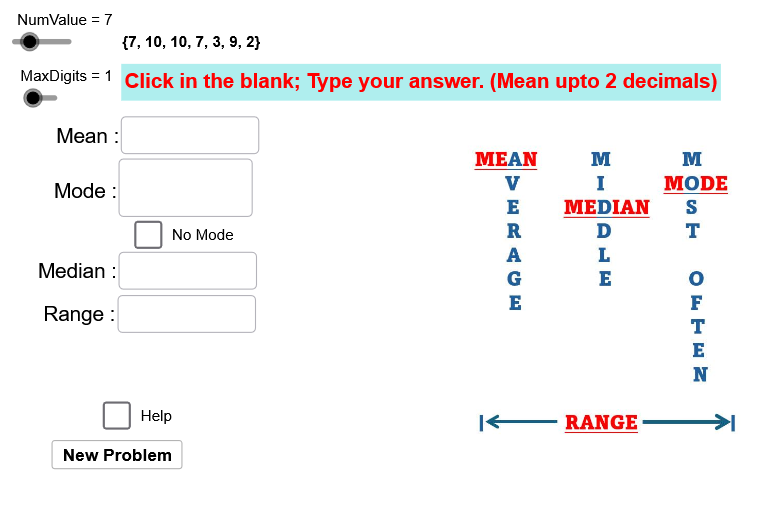
This example demonstrates common data analysis of a list of values, helping students understand the concepts of mean, median, mode, and range. Using GeoGebra commands such as Random, Sequence, and Sort, students can visually see the calculation process of these statistical features. Suitable for middle school and above students to learn basic concepts of data statistics.
GeoGebra Commands & Parameters
Random(10^(minNum), 10^(MaxDigits)) → aSequence(a, k, 1, NumValue) → list1, {7, 10, 10, 7, 3, 9, 2}Sort(list1) → list2Sum(list1) → summean(list1) → mean1Mode(list1) → mode_1Median(list1) → median1Element(range_1, 1) → range1If(range2 ≟ range1, "Great Job") → rangeTextElement(mode_1, 1) → mode1Textfield(text_{mean}) → Input_{mean}Textfield(text_{median}) → Input_{median}Textfield(text_{range}) → Input_{range}If(floor((100 * mean1) + 0.5) / 100 ≟ mean2, "Great Job") → meanTextIf(floor((100 * median1)) / 100 ≟ median2, "Great Job") → medianTextMode(list2) → list_{1}Textfield(list_{empty}) → Input_{mode}If(Length[list_{1}] > 0, If[list_{empty} ≟ mode_1, "Great Job"]) → modeTextIf(list_{1} ≟ {}, "Great Job", "Sorry") → text1