
Mean Function and Mean Hyperbola
Loading the math board and drawing, please wait…
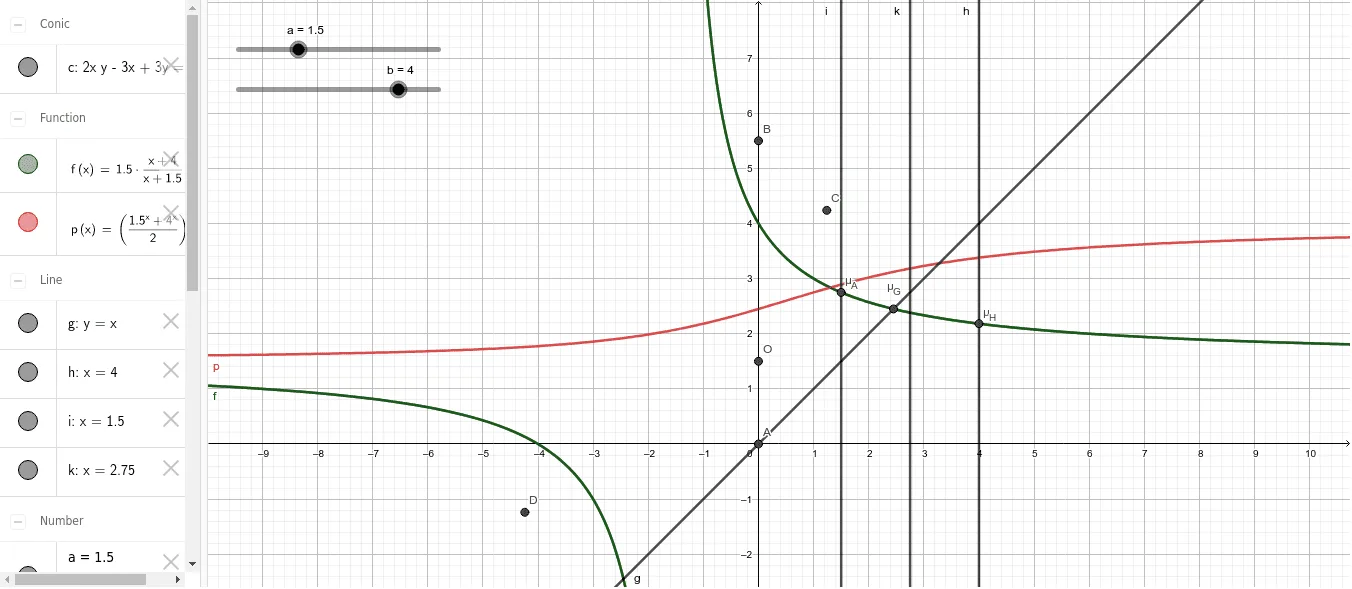
This example demonstrates the geometric relationship and properties between the mean function and the mean hyperbola. It involves core mathematical concepts such as functions, hyperbolas, circles, coordinate geometry, and intersection calculations. The construction highlights GeoGebra commands like Intersect and Focus, utilizing objects a, b, f, B, A, O, g, h, i, μ_G, μ_H, μ_A, c, C, D, p, k. Suitable for high school and above learners to understand the interaction between functions and quadratic curves, as well as geometric constructions.
GeoGebra Commands & Parameters
Intersect(f, g, (2.4494897428810423, 2.4494897427596505)) → μ_GIntersect(f, h, (4, 2.1818181818181817)) → μ_HIntersect(f, i, (1.5, 2.75)) → μ_AFocus(c) → C, D
AI Drawing Prompt Reference
Draw a function curve and a hyperbola, marking the three intersection points with two horizontal lines, representing the mean values of the function, hyperbola, and parabola respectively. Then plot the foci of the hyperbola and connect the foci with the three intersection points to illustrate the geometric relationships.
The prompt above was compiled from the original drawing commands and is for reference only.