
Mean From Frequency Table
Loading the math board and drawing, please wait…
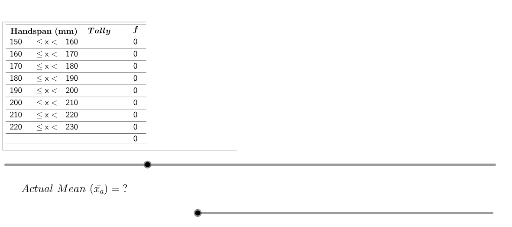
This example demonstrates how to calculate the mean from a frequency table using GeoGebra. It involves core concepts like frequency tables, mean calculation, and data statistics. Key GeoGebra commands used include Sort, CountIf, Sequence, Sum, Join, Mean, TableText, and Polygon for data processing and visualization. Suitable for middle school mathematics teaching, focusing on data analysis and introductory statistics.
GeoGebra Commands & Parameters
Sort(RemoveUndefined[A2:A1000]) → list1CountIf(C2 ≤ x < E2, list1) → G2CountIf(C3 ≤ x < E3, list1) → G3CountIf(C4 ≤ x < E4, list1) → G4CountIf(C5 ≤ x < E5, list1) → G5CountIf(C6 ≤ x < E6, list1) → G6CountIf(C7 ≤ x < E7, list1) → G7Sequence(H3, i, 0, G3 - 1) → list3Sequence(H2, i, 0, G2 - 1) → list2Sequence(H4, i, 0, G4 - 1) → list4Sequence(H5, i, 0, G5 - 1) → list5Sequence(H6, i, 0, G6 - 1) → list6Sequence(H7, i, 0, G7 - 1) → list7CountIf(C8 ≤ x < E8, list1) → G8CountIf(C9 ≤ x < E9, list1) → G9Sequence(H8, i, 0, G8 - 1) → list8Sequence(H9, i, 0, G9 - 1) → list9Sort(RemoveUndefined[A2:A100]) → list1_1CountIf(C3 < x ≤ E3, list1_1) → G3_1CountIf(C4 < x ≤ E4, list1_1) → G4_1CountIf(C2 < x ≤ E2, list1_1) → G2_1Sort(RemoveUndefined[A2:A100]) → list1_2CountIf(C3 < x ≤ E3, list1_2) → G3_2CountIf(C4 < x ≤ E4, list1_2) → G4_2CountIf(C2 < x ≤ E2, list1_2) → G2_2Sum(G2:G9) → G10Sum(K2:K9) → K10Join({list2, list3, list4, list5, list6, list7, list8, list9}) → list10Sort(list1) → list11Mean(list1) → aTableText({{C1, D1, E1, F1, G1, H1, I1, J1, K1}, {C2, D2, E2, F2, G2, H2, I2, J2, K2}, {C3, D3, E3, F3, G3, H3, I3, J3, K3}, {C4, D4, E4, F4, G4, H4, I4, J4, K4}, {C5, D5, E5, F5, G5, H5, I5, J5, K5}, {C6, D6, E6, F6, G6, H6, I6, J6, K6}, {C7, D7, E7, F7, G7, H7, I7, J7, K7}, {C8, D8, E8, F8, G8, H8, I8, J8, K8}, {C9, D9, E9, F9, G9, H9, I9, J9, K9}, {C10, D10, E10, F10, G10, H10, I10, J10, K10}}, "l_") → text5Polygon(A, C, D, B) → poly1, a_1, c_1, d, b_1Polygon(G, H, F, E) → poly2, g, h, f, e_1