
Matrix Addition Visualization
Loading the math board and drawing, please wait…
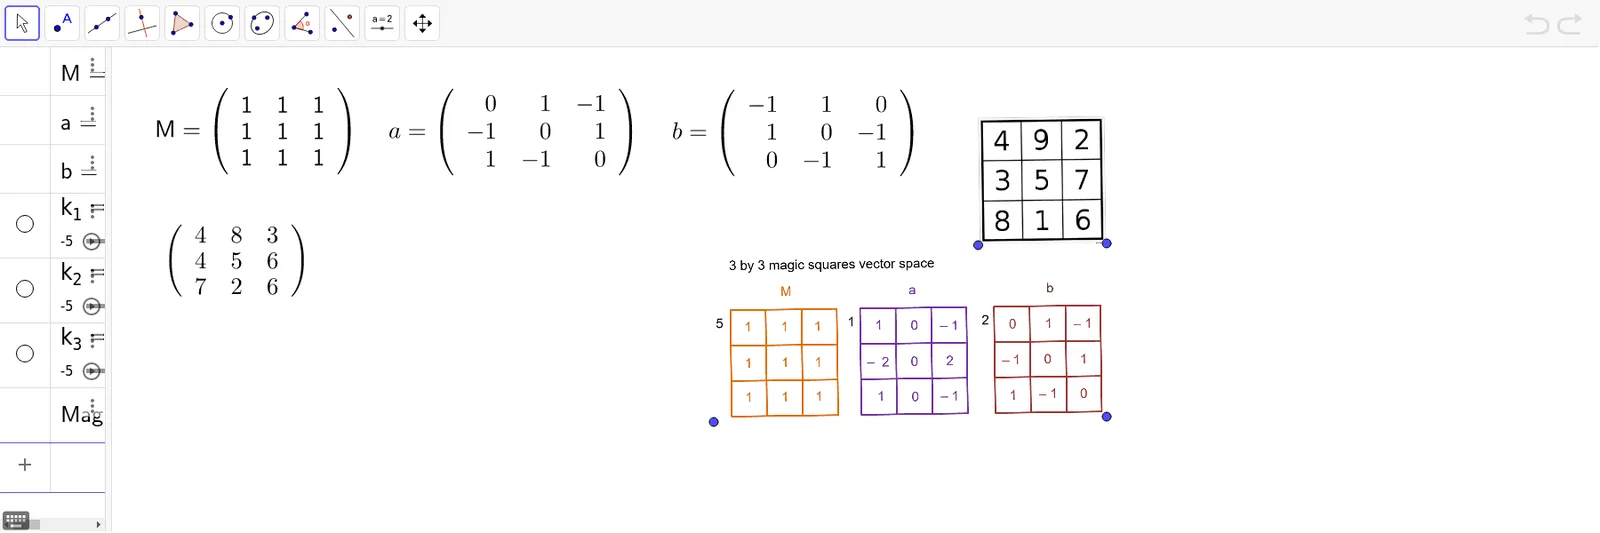
This GeoGebra example demonstrates the geometric interpretation of matrix addition through dynamic visualization. The core mathematical concept is element-wise addition of matrices, often represented as vector or point translations. The construction uses objects A, B, M to denote matrices or vectors, parameters k1, k2, k3 to control components, and images/text (pic1, pic2, text1-4) to label results. It may include line segments and intersection points to aid understanding. Suitable for high school or introductory linear algebra courses, this tool helps students grasp how adding matrices corresponds to combining transformations or displacements. Sliders can be used to explore various matrix combinations and observe the resulting sums.
GeoGebra Commands & Parameters
Point A(-2.08, -1.54)Point B(6.76, -1.42){{1, 1, 1}, {1, 1, 1}, {1, 1, 1}}{{0, 1, -1}, {-1, 0, 1}, {1, -1, 0}}{{-1, 1, 0}, {1, 0, -1}, {0, -1, 1}}Numeric k_{1}(5)Numeric k_{2}(2)Numeric k_{3}(1)(k_{1} * M) + (k_{2} * a) + (k_{3} * b)(3.87, 2.44)(6.76, 2.48)