
Math Problem on the Move 8
Loading the math board and drawing, please wait…
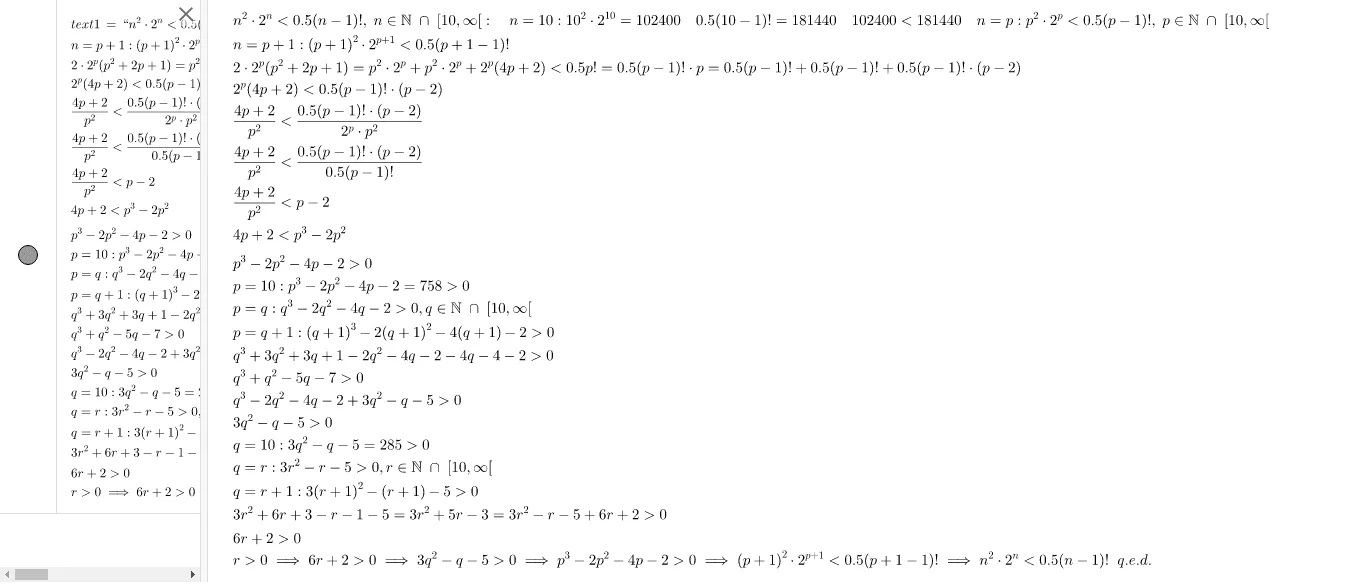
This example demonstrates the last problem in the 'On the Move' series, involving inequalities and cosine functions. By adjusting parameters, one can dynamically observe the changes in the solution set. Suitable for high school students, this example helps them understand the geometric meaning of inequalities and the periodicity of cosine functions. The GeoGebra text object is used to intuitively show the changes in the solution set.
AI Drawing Prompt Reference
Create a dynamic math diagram illustrating an inequality involving a cosine function. Show a coordinate plane with a smooth cosine curve representing periodic behavior. Shade the regions on the graph that satisfy the inequality, and include a slider that adjusts a parameter, causing the curve and shaded solution set to change dynamically. Add a text label near the graph that updates to show the current solution range or a hint about the changes. The overall design should be clean and educational, suitable for high school students to explore the geometric meaning of inequalities and the periodicity of cosine functions.
The prompt above was compiled from the original drawing commands and is for reference only.