
Matching Pie Chart to Dot Plot
Loading the math board and drawing, please wait…
In collections
Statistics Demonstrations
Statistics Demonstrations
Statistics Demonstrations
Statistics Demonstrations
Statistics Demonstrations
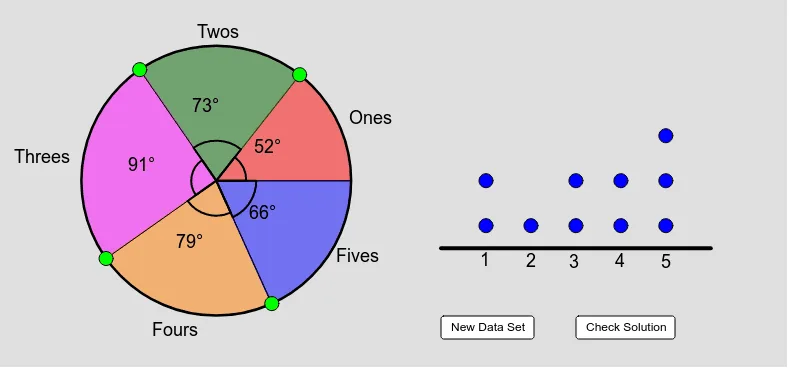
This example demonstrates how to adjust pie chart sectors by dragging points to accurately represent the distribution of dot plot data. Key math concepts include probability & statistics, data visualization, and angle measurement. Construction involves commands/objects like Random, DotPlot, Circle, Point, CircleSector, Angle, CircleArc, AngularBisector, Intersect, Midpoint, CountIf, Rotate, Segment, suitable for high school students learning data analysis and statistics.
GeoGebra Commands & Parameters
Random(1, 5) → A6Random(1, 5) → A7Random(1, 5) → A8Random(1, 5) → A9Random(1, 5) → A10DotPlot(list1) → list2Circle(A, 3) → cPoint(c) → BPoint(c) → CPoint(c) → DPoint(c) → EPoint(c) → FCircleSector(A, B, C) → dCircleSector(A, C, D) → eCircleSector(A, D, E) → fCircleSector(A, E, F) → gCircleSector(A, F, B) → hAngle(B, A, C) → αAngle(C, A, D) → βAngle(D, A, E) → γAngle(E, A, F) → δAngle(F, A, B) → εCircleArc(A, B, C) → kCircleArc(A, C, D) → pCircleArc(A, D, E) → qCircleArc(A, E, F) → rCircleArc(A, F, B) → sAngularBisector(B, A, C) → aAngularBisector(C, A, D) → bAngularBisector(D, A, E) → iAngularBisector(E, A, F) → jAngularBisector(F, A, B) → lIntersect(k, a) → G,Intersect(p, b) → H,Intersect(q, i) → I,Intersect(r, j) → J,Intersect(s, l) → K,Midpoint(H, A) → LMidpoint(I, A) → MMidpoint(J, A) → NMidpoint(K, A) → OMidpoint(G, A) → PCountIf(x ≟ 1, list1) → onesCountIf(x ≟ 2, list1) → twosCountIf(x ≟ 3, list1) → threesCountIf(x ≟ 4, list1) → foursCountIf(x ≟ 5, list1) → fivesRotate(B, ones * 0.1 * 2 * π, A) → CCRotate(CC, twos * 0.1 * 2 * π, A) → DDRotate(DD, threes * 0.1 * 2 * π, A) → EERotate(EE, fours * 0.1 * 2 * π, A) → FFSegment((0, 0.5), (6, 0.5)) → mPoint(m) → QPoint(m) → RPoint(m) → SPoint(m) → TPoint(m) → USegment(E, A) → nSegment(A, D) → tSegment(A, F) → a_1Segment(A, B) → b_1
AI Drawing Prompt Reference
Create a chart showing the relationship between a pie chart and a dot plot. Generate five random numbers and represent this data with a dot plot. Draw a circle with one point as the center and place six points evenly on the circle. Use these points to create six sectors, each representing a part of the pie chart. Measure the central angles of each sector and calculate the corresponding arcs. Determine the exact boundaries of the sectors by finding the intersections of angle bisectors with the arcs. Finally, adjust the sizes of the sectors based on the dot plot data to make the pie chart accurately reflect the distribution.
The prompt above was compiled from the original drawing commands and is for reference only.