
Mapping Diagram of Function: RP1 to RP1
Loading the math board and drawing, please wait…
In collections
Graphs and Mapping Diagrams
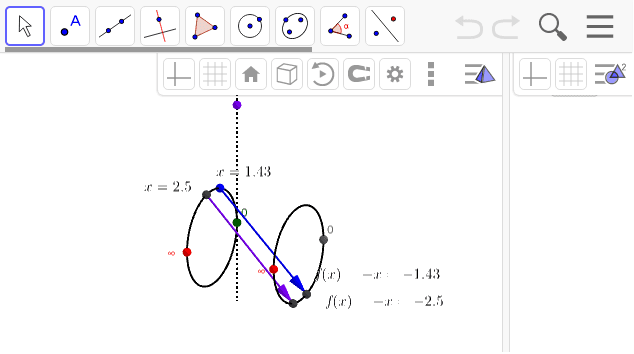
This example demonstrates a mapping diagram visualizing a function from RP1 (which is S1) to RP1 (which is S1). Core math concepts include functions, mappings, and analytical geometry. It is constructed using GeoGebra commands/objects like Line, Circle, Point, Intersect, Vector, and Textfield. Suitable for high school and above learners to understand function mappings and geometric representations.
GeoGebra Commands & Parameters
Line(A, (1, 0, 0)) → aCircle(a, B) → cCircle(a, C) → dPoint(c) → P_xLine((0, -1, 0), P_x) → bLine(A, (0, 0, 1)) → eLine(B, e) → tan_xIntersect(tan_x, b) → T_xLine(T_{f(x)}, Q_∞) → gIntersect(g, d) → E, Q_{f(x)}Vector(P_x, Q_{f(x)}) → a_fTextfield(f) → inputBox1Point(tan_x) → T_{x0}Line(T_{x0}, P_∞) → hIntersect(h, c) → F, P_{x0}Line(T_{f(x0)}, Q_∞) → iIntersect(i, d, 2) → Q_{f(x0)}Vector(P_{x0}, Q_{f(x0)}) → u
AI Drawing Prompt Reference
Draw a mapping diagram for a function from the unit circle to itself, showing the function relationship. Include unit circles, input points, and output points, with tangents and perpendiculars to determine mapping locations, and vectors to represent function mapping directions. Start by drawing horizontal lines and two unit circles, then find the tangent and perpendicular intersection points for the input, determine the output points, and finally connect and label key points and vectors to clearly show the geometric representation of the function.
The prompt above was compiled from the original drawing commands and is for reference only.