
Mapping Diagram and Graph for 3 Variables
Loading the math board and drawing, please wait…
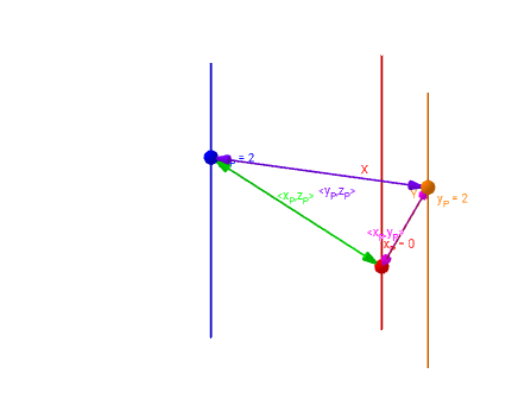
This example demonstrates the mapping diagram and graph for three variables, involving geometric objects in three-dimensional space such as vectors, lines, and rays. Using GeoGebra commands like Polygon, Vector, and Line, it provides a clear understanding of the geometric relationships in three-dimensional space. Suitable for high school and above students or teachers.
GeoGebra Commands & Parameters
Polygon(A, B, C) → poly1, b, c, aVector(B, C) → gVector(A, B) → vVector(A, C) → wVector(C, A) → dVector(C, B) → eVector(B, A) → fLine((0, n, 0), u) → YLine((n, 0, 0), u) → ZLine((0.1, 0.1, 0), u) → XRay((-10, 0, 0), (1, 0, 0)) → jRay((0, -10, 0), (0, 1, 0)) → kRay((0, 0, -10), (0, 0, 1)) → l