
Maclaurin Series exp(x) Visualization
Loading the math board and drawing, please wait…
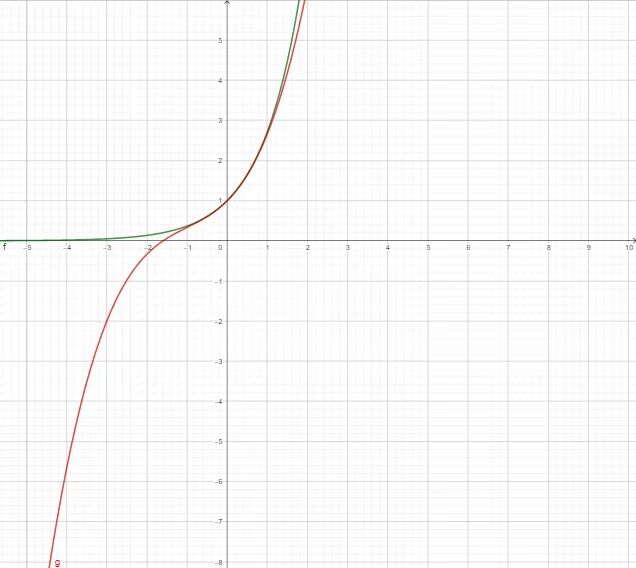
This example demonstrates how to visualize the Maclaurin series expansion of the function exp(x) using GeoGebra. Key mathematical concepts include Maclaurin series, Taylor series, function approximation, and infinite series. The construction utilizes the GeoGebra command TaylorSeries with objects f (function), n (degree slider), and g (series output). Suitable for high school and above mathematics learners to understand function series expansion and its graphical representation.
GeoGebra Commands & Parameters
TaylorSeries(f, 0, n) → g
AI Drawing Prompt Reference
Visualize the Maclaurin series expansion of the function exp(x), showing the original function curve and a series of approximating curves that change as the degree slider is adjusted, demonstrating how the series better approximates the original function with higher degrees.
The prompt above was compiled from the original drawing commands and is for reference only.