
Möbius Transformations Interactive Demo
Loading the math board and drawing, please wait…
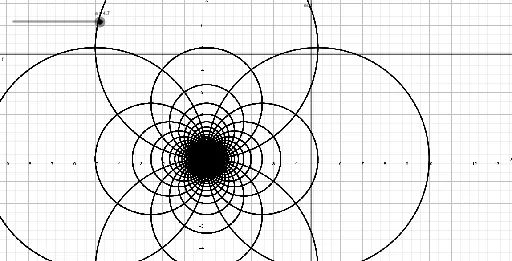
① This GeoGebra example dynamically illustrates Möbius transformations (fractional linear maps) on the complex plane, showing how lines and circles are mapped to lines or circles while preserving angles. ② Core mathematical concepts include complex analysis, Möbius transformation formula (az+b)/(cz+d), conformal mapping, and the interplay between complex numbers and geometric objects like parabolas and secant lines. ③ Construction details: The summary lists objects a, eq1, eq2, f, eq3 — likely a slider 'a' controlling transformation parameters, equations eq1/eq2/eq3 defining initial curves (e.g., a parabola or line), and function f representing the transformed image. GeoGebra's linked algebra and geometry views allow real-time manipulation and observation of how the mapping alters shapes. ④ Suitable for university-level complex analysis courses or advanced high school enrichment, this demo helps learners visualize the geometric essence of Möbius transformations, including circle/line preservation and angle invariance, and serves as an effective teaching tool for instructors.
GeoGebra Commands & Parameters
Numeric a(4.7)x = a(x - 1 / ((2 * a)))^(2) + y^(2) = (1 / ((2 * a)))^(2)y = ax^(2) + (y + 1 / ((2 * a)))^(2) = 1 / ((2 * a))^(2)
AI Drawing Prompt Reference
Draw a dynamic complex plane illustration of Möbius transformations. Start with a vertical line whose position is controlled by a parameter. Then add a circle centered at the intersection of this line with the real axis, with radius equal to the reciprocal of the parameter, tangent to the real axis at the origin. Next, draw a horizontal line also controlled by the parameter. Finally, add a circle centered at the intersection of this horizontal line with the imaginary axis, with radius equal to the reciprocal of the parameter, tangent to the imaginary axis at the origin. All objects update as the parameter changes, showing how lines and circles map under the transformation.
The prompt above was compiled from the original drawing commands and is for reference only.