
Dynamic Construction of the Graph of |f(x)|
Loading the math board and drawing, please wait…
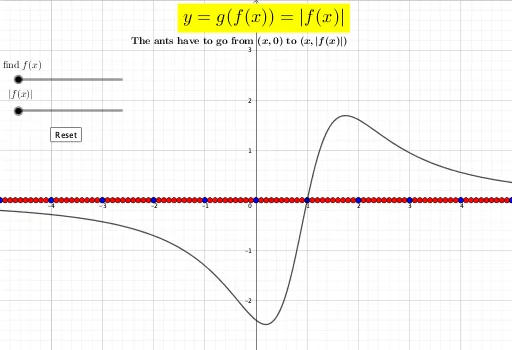
① This example uses an ant-like moving point along the curve to vividly demonstrate how to construct the graph of the absolute value function |f(x)| from any given function f(x), by reflecting the portion below the x-axis upward across the x-axis. ② The core mathematical concepts include absolute value transformations, function graphs, zeros, sign changes, and piecewise functions, combined with sequences and dynamic geometry. ③ Construction highlights: The GeoGebra commands include Sequence to generate a series of points or loci, a button (button1) to control animation, and objects such as f, k, l, X, Q, g, Z, S to build the dynamic process, with text labels (text1, text6_1) and boundary coordinates (xl, yt, xr, yb) to annotate the viewing window. ④ This is suitable for middle and high school mathematics teaching, especially for visualizing the geometric meaning of absolute value transformations, and can be used as a dynamic demonstration or for student exploration.
GeoGebra Commands & Parameters
Sequence(-5 + (0.1 * i), i, 0, 100) → XSequence(i, i, -5, 5) → Z
AI Drawing Prompt Reference
Draw the graph of function f(x) and dynamically show its absolute value |f(x)|. First, generate a sequence of points X on the x-axis, then create boundary coordinates Z for the y-axis. Reflect the part below the x-axis to construct the graph of |f(x)|. Use a button to control the animation and observe the changes in the function and its absolute value graph.
The prompt above was compiled from the original drawing commands and is for reference only.