
LSRL: Residuals and Residual Squares for 3 Points
Loading the math board and drawing, please wait…
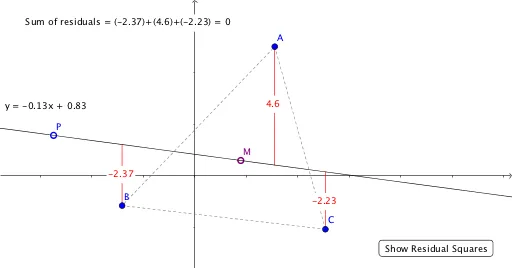
This example demonstrates fitting a linear regression line through three points and calculating residuals and residual squares. Key math concepts include linear regression, residuals, least squares method, and coordinate geometry. It uses commands like Centroid, OrthogonalLine, Line, Intersect, Segment, Midpoint, ConvexHull, Polygon, FitLineY, Distance from GeoGebra. Suitable for high school mathematics teaching, focusing on data fitting and error analysis.
GeoGebra Commands & Parameters
Centroid(Polygon[{A, B, C}]) → MOrthogonalLine(B, xAxis) → gOrthogonalLine(A, xAxis) → hOrthogonalLine(C, xAxis) → iLine(P, M) → fIntersect(f, g) → EIntersect(f, h) → FIntersect(f, i) → GSegment(B, E) → jSegment(A, F) → kSegment(G, C) → lMidpoint(j) → HMidpoint(k) → IMidpoint(l) → JConvexHull({A, B, C}) → graph1Polygon(E, B, 4) → poly1, m, n, p, q, D, KPolygon(A, F, 4) → poly2, r, s, t, a, L, NPolygon(G, C, 4) → poly3, b, c, d, e, O, QFitLineY({A, B, C}) → f_1Distance(P, f_1) → o
AI Drawing Prompt Reference
Draw a linear regression plot with three points, showing the regression line, residuals, and residual squares. First, plot three points and find their centroid. Draw perpendicular lines from the centroid to each point to get the feet of the perpendiculars. Connect each foot to its corresponding point to form residual segments, and calculate the midpoints of these segments. Construct squares using these midpoints and feet of the perpendiculars. Finally, draw the line fitting the three points and label the residual distances.
The prompt above was compiled from the original drawing commands and is for reference only.